
Note
Go to the end to download the full example code.
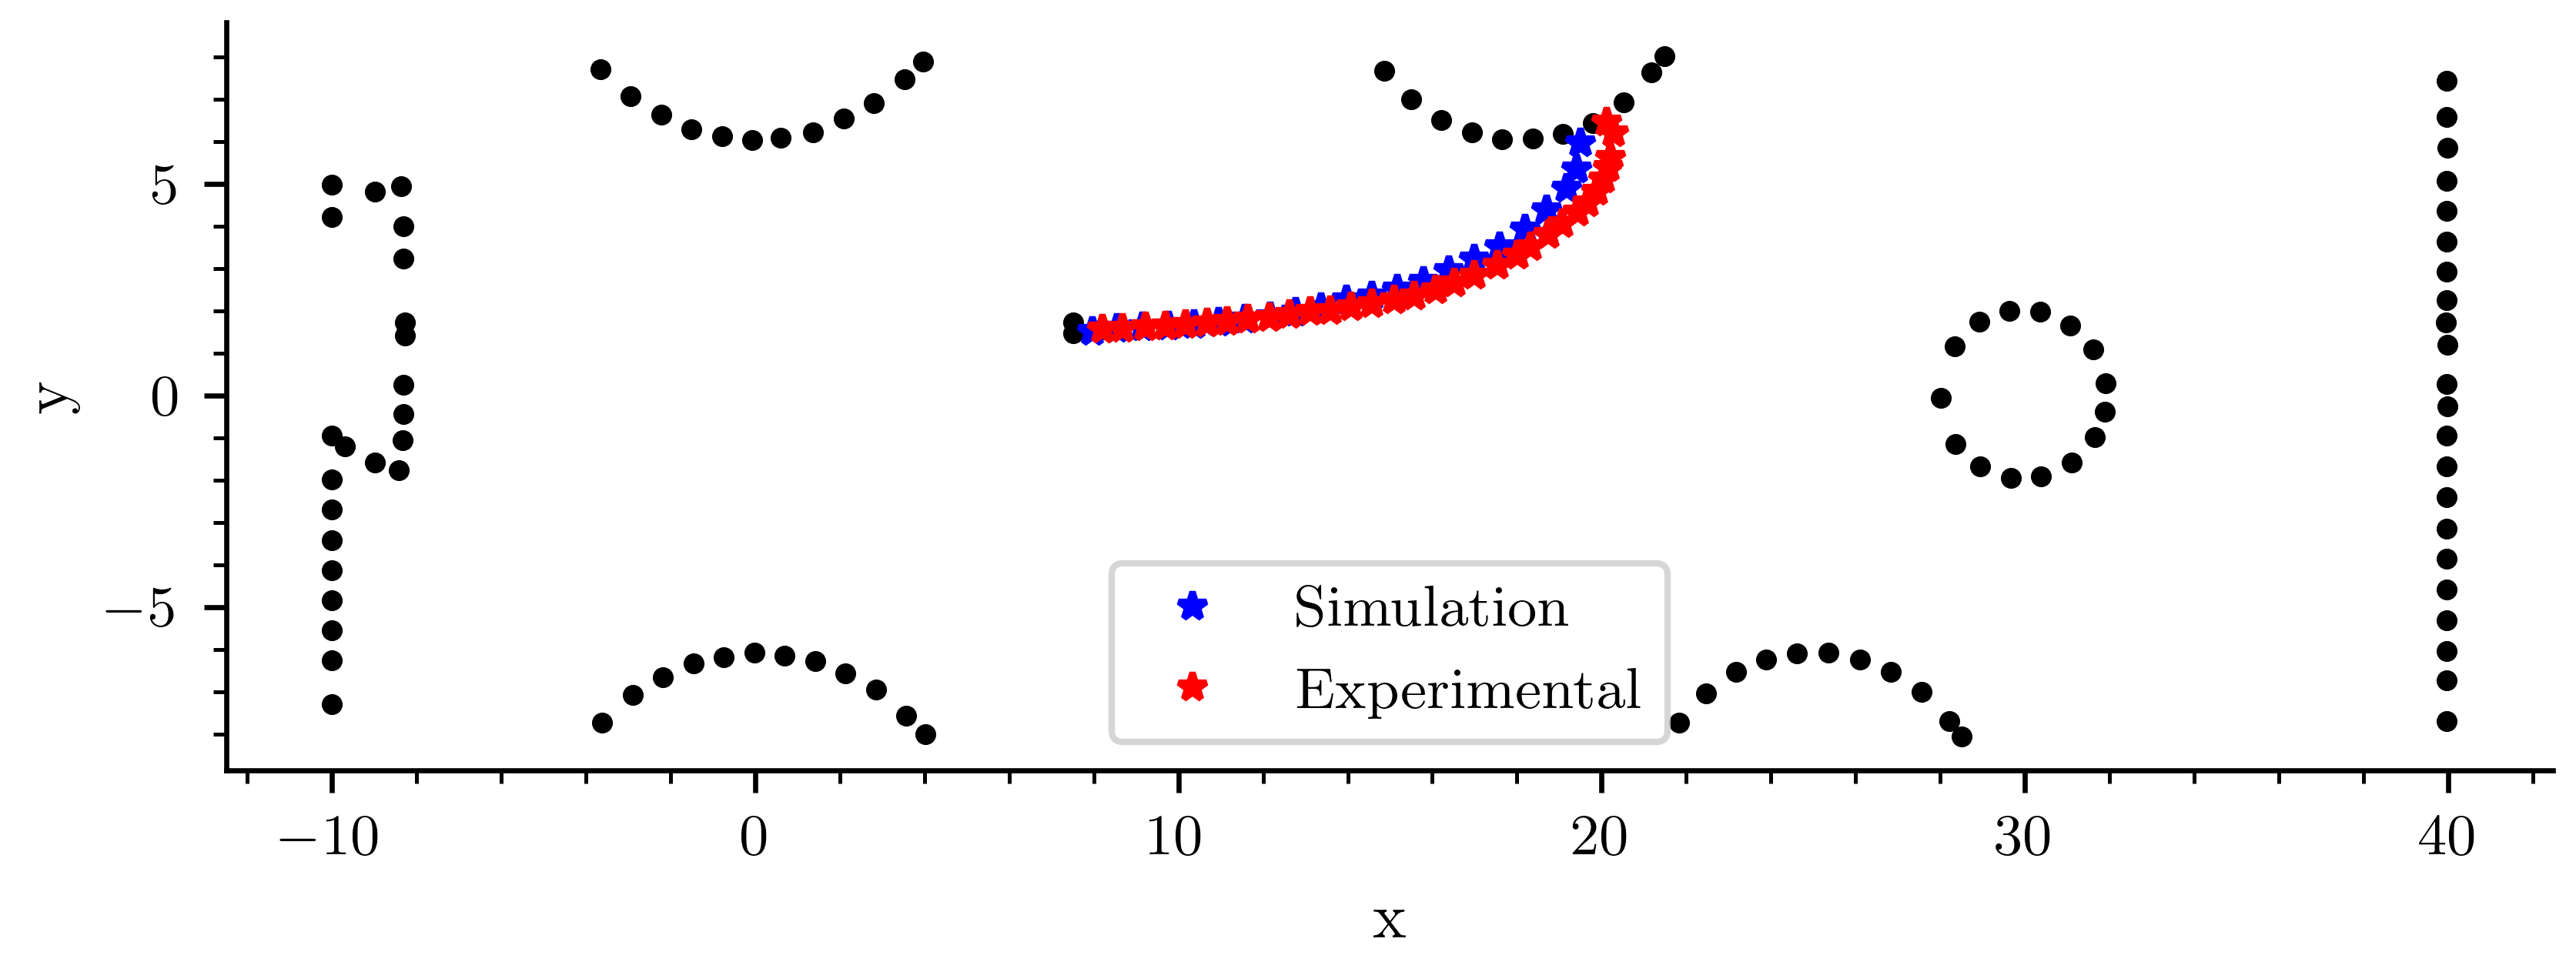
Comparison: Crack path#
import numpy as np
import pyvista as pv
import matplotlib.pyplot as plt
import os
Plot: Force vs Vertical Displacement#
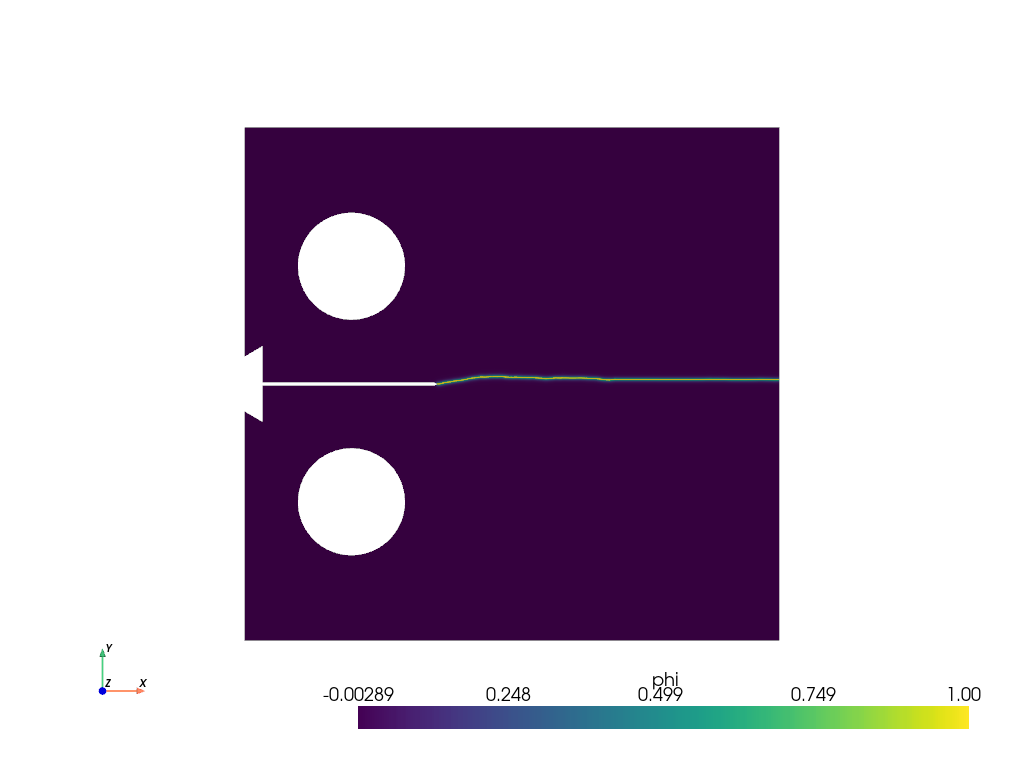
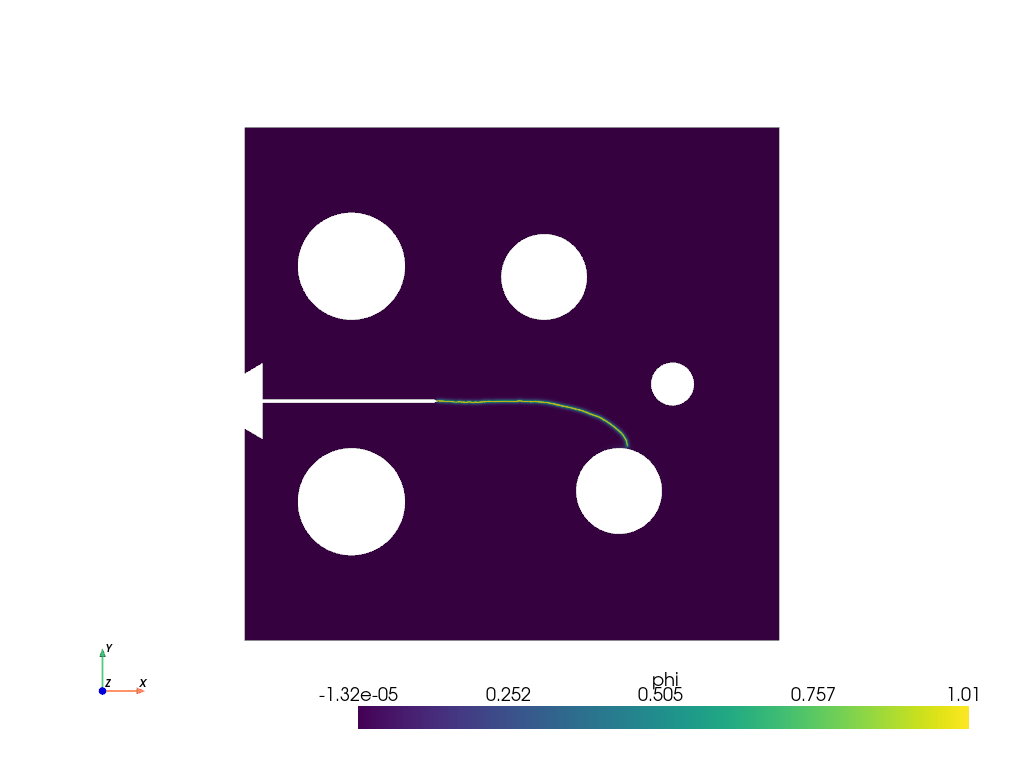
Plot: Phase-Field Distribution at Final State#
This plot visualizes the phase-field variable φ across the specimen at the final simulation step. The phase-field φ varies from 0 (intact material) to 1 (fully damaged/cracked material), showing the crack path and damage evolution.
Specimen 1#
pv.start_xvfb()
specimen_1_H00 = pv.read(os.path.join("../Phase_Field_Compact_Specimen/results_specimen_1_H00", "paraview-solutions_vtu", "phasefieldx_p0_000162.vtu"))
specimen_1_H00.plot(scalars='phi', cpos='xy', show_scalar_bar=True, show_edges=False)
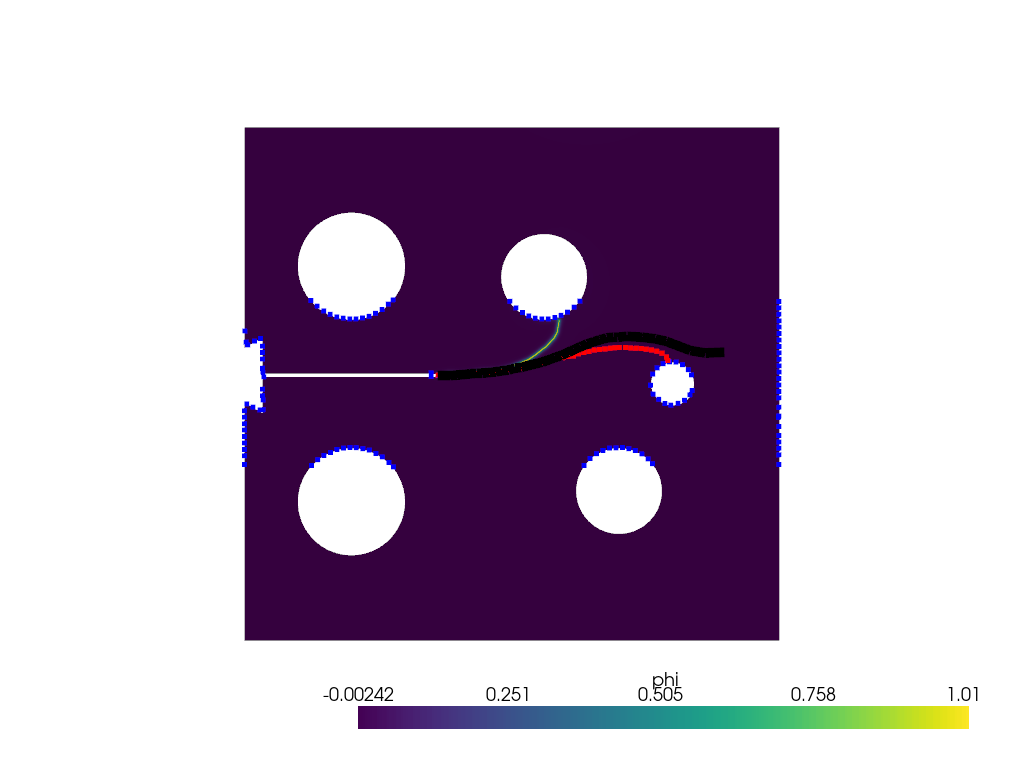
Specimen 2#
specimen_2_H16 = pv.read(os.path.join("../Phase_Field_Compact_Specimen/results_specimen_2_H16", "paraview-solutions_vtu", "phasefieldx_p0_000159.vtu"))
specimen_2_H16.plot(scalars='phi', cpos='xy', show_scalar_bar=True, show_edges=False)


folder_paper = "../Papers_Data/Wagner_phd/fig510"
paper_frame        = np.loadtxt(os.path.join(folder_paper,"reference.txt"))
paper_simulation   = np.loadtxt(os.path.join(folder_paper,"simulation.txt"))
paper_experimental = np.loadtxt(os.path.join(folder_paper,"experimental.txt"))

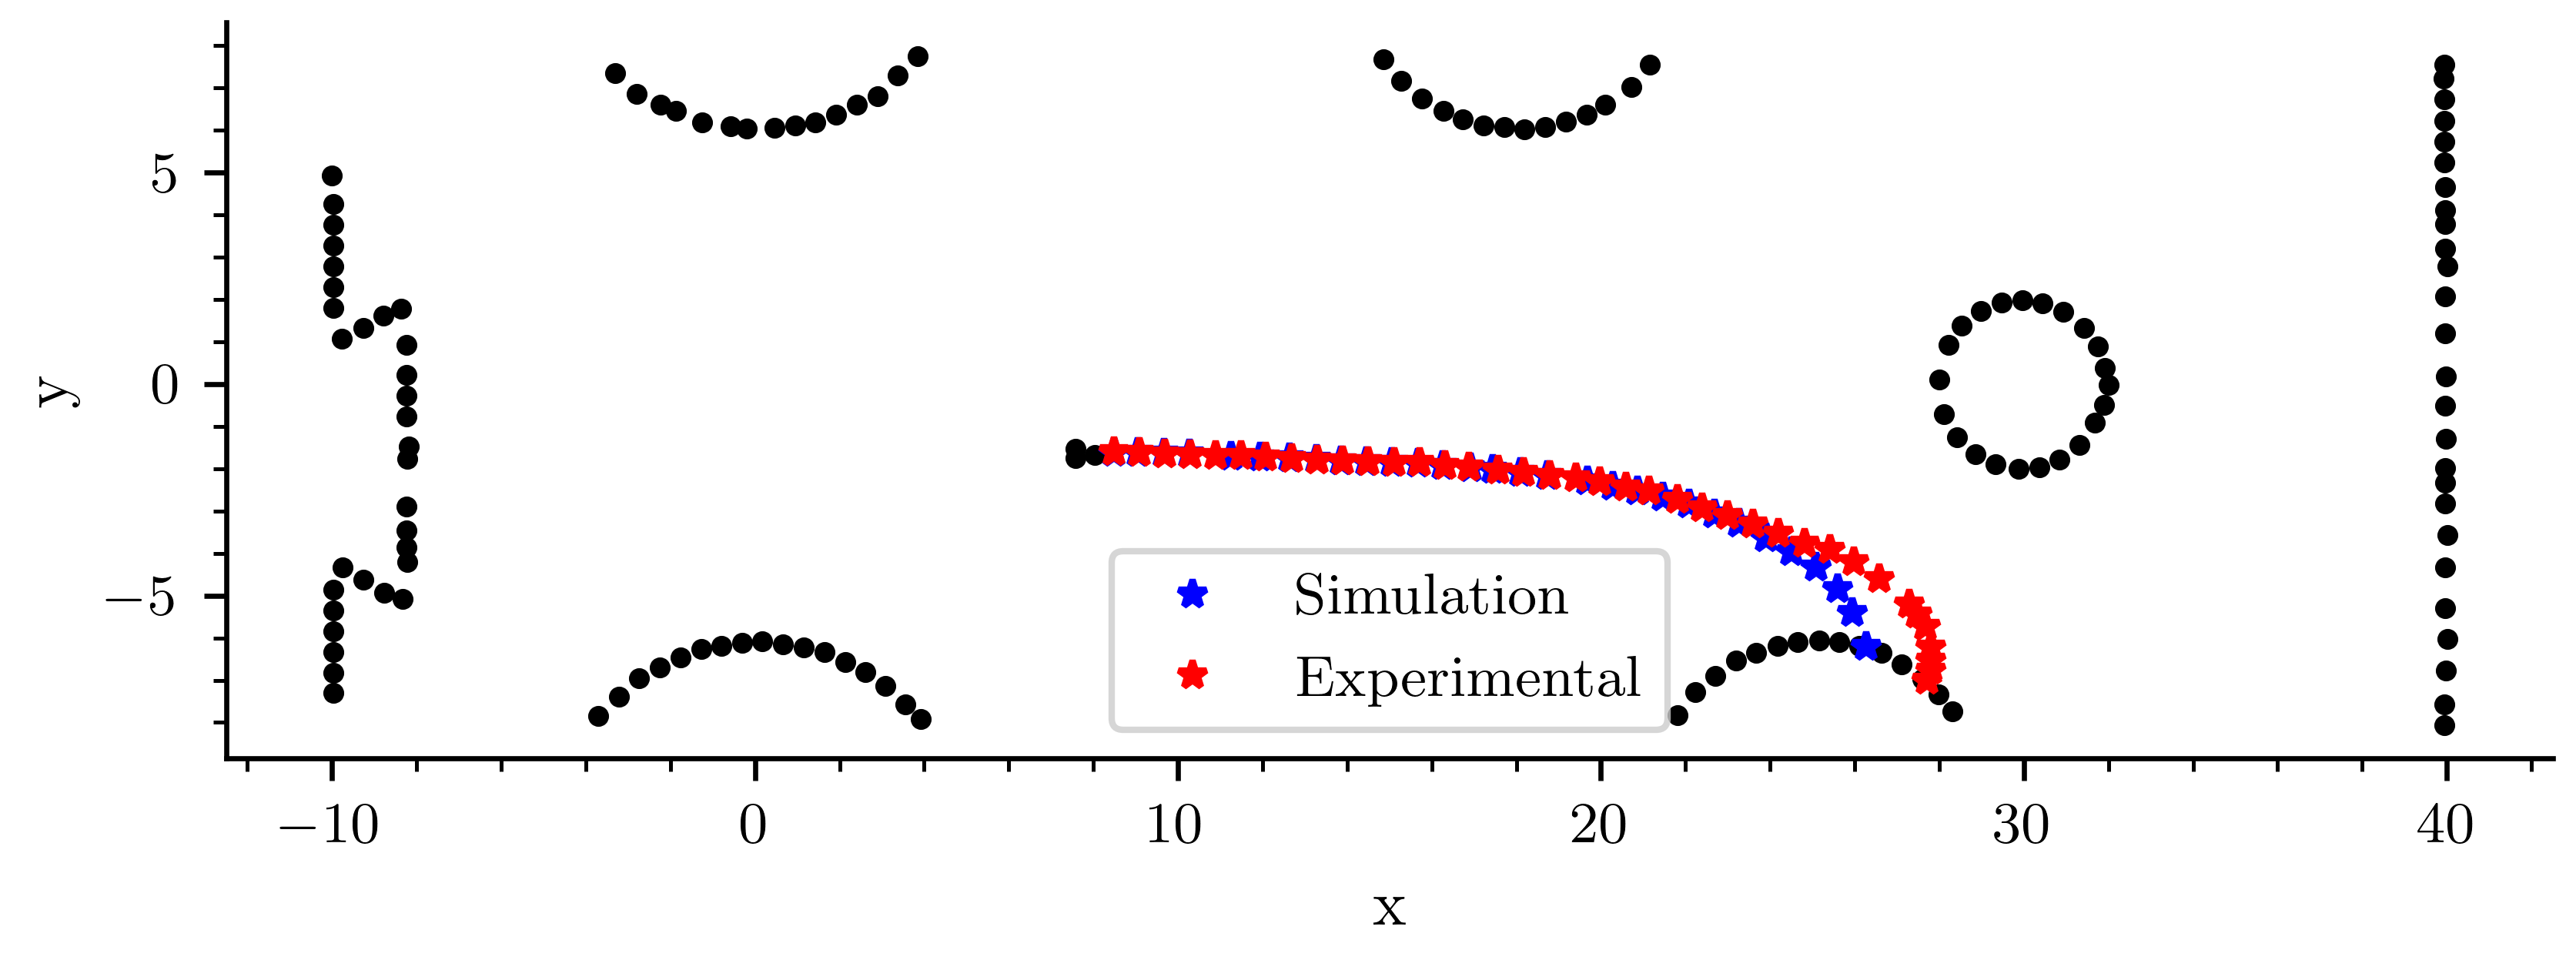
Plot the comparison of the crack path
fig, ax_reaction = plt.subplots()

ax_reaction.plot(paper_frame[:,0], paper_frame[:,1], 'k.', linewidth=2.0)
ax_reaction.plot(paper_simulation[:,0], paper_simulation[:,1], 'b*', linewidth=2.0, label="Simulation")
ax_reaction.plot(paper_experimental[:,0], paper_experimental[:,1], 'r*', linewidth=2.0, label="Experimental")

ax_reaction.grid(False)
ax_reaction.set_xlabel('x')
ax_reaction.set_ylabel('y')
ax_reaction.legend()
ax_reaction.set_aspect('equal', adjustable='box')
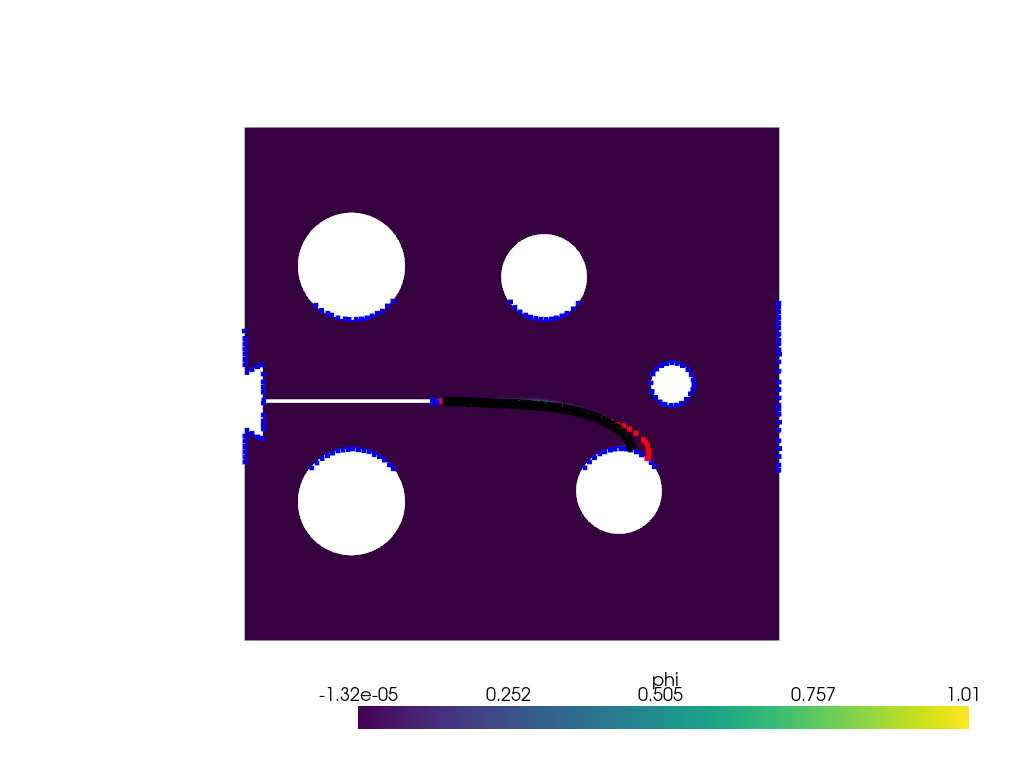
Plot the comparison of the crack path with phase-field distribution Create a PolyData line
x = paper_simulation[:, 0]
y = paper_simulation[:, 1]
z = np.zeros_like(x)

# Create a PolyData line
xf = paper_experimental[:, 0]
yf = paper_experimental[:, 1]
xf = xf
zf = np.zeros_like(xf)

# Stack into (N, 3) array for line points

xc = paper_frame[:, 0]
yc = paper_frame[:, 1]
xc = xc
zc = np.zeros_like(xc)


line_points = np.column_stack((x, y, z))
line_points_f = np.column_stack((xf, yf, zf))
line_points_frame = np.column_stack((xc, yc, zc))

line = pv.lines_from_points(line_points)

# Create a plotter and add your mesh and the line
plotter = pv.Plotter()
plotter.add_mesh(specimen_2_H16, scalars='phi')
plotter.add_mesh(line_points_frame, color='blue', line_width=10)
plotter.add_mesh(line_points_f, color='red', line_width=10, label='experimental')
plotter.add_mesh(line, color='black', line_width=10, label='simulation')

plotter.view_xy()
plotter.show()

plt.show()

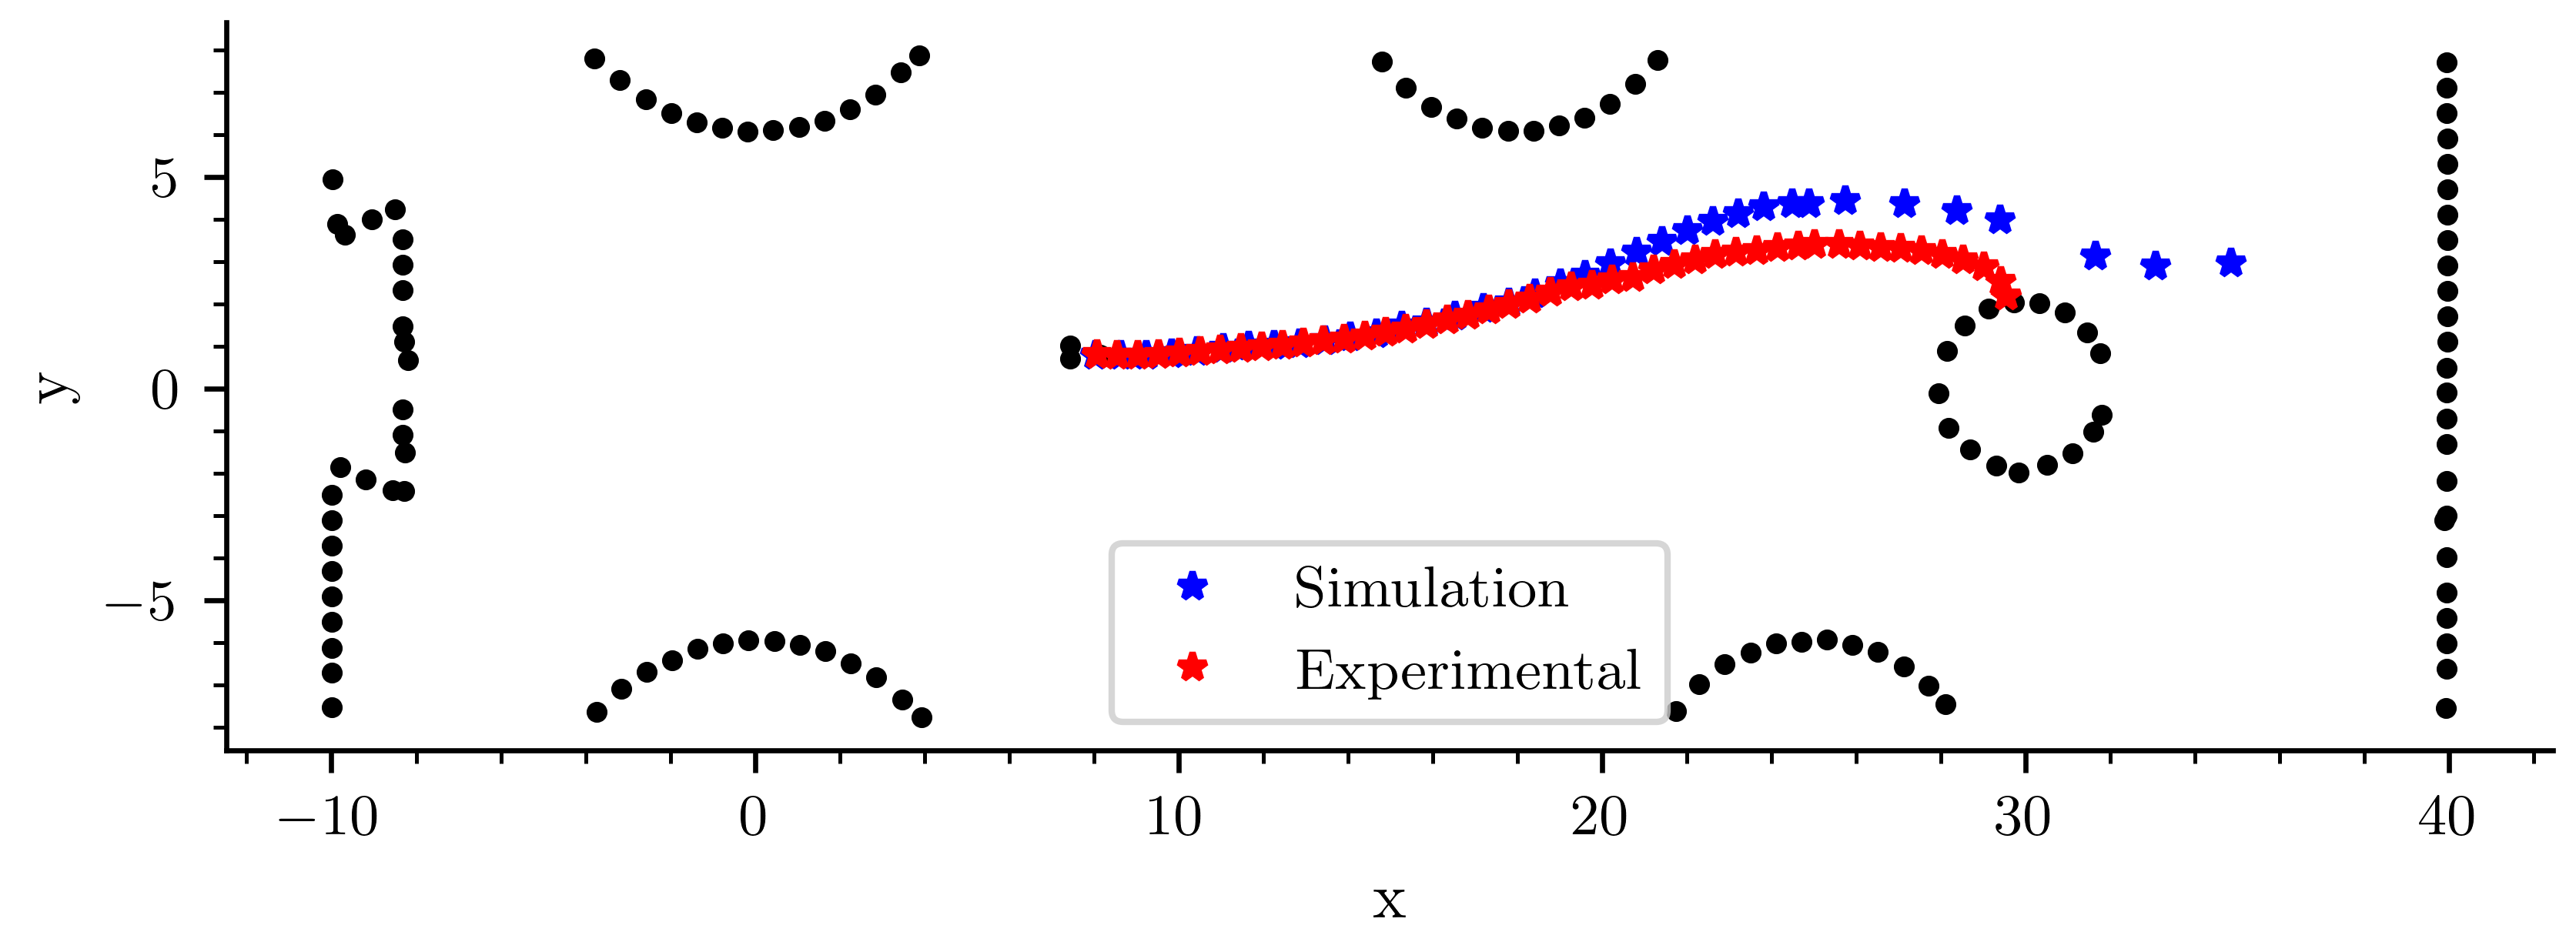
Specimen 3#
specimen_3_H08 = pv.read(os.path.join("../Phase_Field_Compact_Specimen/results_specimen_3_H08", "paraview-solutions_vtu", "phasefieldx_p0_000174.vtu"))
specimen_3_H08.plot(scalars='phi', cpos='xy', show_scalar_bar=True, show_edges=False)

folder_paper = "../Papers_Data/Wagner_phd/fig512a"
paper_frame = np.loadtxt(os.path.join(folder_paper,"reference.txt"))
paper_simulation = np.loadtxt(os.path.join(folder_paper,"FRANC3D.txt"))
paper_experimental = np.loadtxt(os.path.join(folder_paper,"experimental.txt"))


fig, ax_reaction = plt.subplots()

ax_reaction.plot(paper_frame[:,0], paper_frame[:,1], 'k.', linewidth=2.0)
ax_reaction.plot(paper_simulation[:,0], paper_simulation[:,1], 'b*', linewidth=2.0, label="Simulation")
ax_reaction.plot(paper_experimental[:,0], paper_experimental[:,1], 'r*', linewidth=2.0, label="Experimental")

ax_reaction.grid(False)
ax_reaction.set_xlabel('x')
ax_reaction.set_ylabel('y')
ax_reaction.legend()
ax_reaction.set_aspect('equal', adjustable='box')


# Create a PolyData line
x = paper_simulation[:, 0]
y = paper_simulation[:, 1]
z = np.zeros_like(x)

# Create a PolyData line
xf = paper_experimental[:, 0]
yf = paper_experimental[:, 1]
xf = xf
zf = np.zeros_like(xf)

# Stack into (N, 3) array for line points

xc = paper_frame[:, 0]
yc = paper_frame[:, 1]
xc = xc
zc = np.zeros_like(xc)


line_points = np.column_stack((x, y, z))
line_points_f = np.column_stack((xf, yf, zf))
line_points_frame = np.column_stack((xc, yc, zc))

line = pv.lines_from_points(line_points)

# Create a plotter and add your mesh and the line
plotter = pv.Plotter()
plotter.add_mesh(specimen_3_H08, scalars='phi')
plotter.add_mesh(line_points_frame, color='blue', line_width=10)
plotter.add_mesh(line_points_f, color='red', line_width=10, label='experimental')
plotter.add_mesh(line, color='black', line_width=10, label='simulation')

plotter.view_xy()
plotter.show()

plt.show()

Specimen 4#
specimen_4_Hminus16 = pv.read(os.path.join("../Phase_Field_Compact_Specimen/results_specimen_4_Hminus16", "paraview-solutions_vtu", "phasefieldx_p0_000248.vtu"))
specimen_4_Hminus16.plot(scalars='phi', cpos='xy', show_scalar_bar=True, show_edges=False)
Plot: Force vs Vertical Displacement#
folder_paper = "../Papers_Data/Wagner_phd/fig511"
paper_frame = np.loadtxt(os.path.join(folder_paper,"reference.txt"))
paper_simulation = np.loadtxt(os.path.join(folder_paper,"FRANC3D.txt"))
paper_experimental = np.loadtxt(os.path.join(folder_paper,"experimental.txt"))


fig, ax_reaction = plt.subplots()

ax_reaction.plot(paper_frame[:,0], paper_frame[:,1], 'k.', linewidth=2.0)
ax_reaction.plot(paper_simulation[:,0], paper_simulation[:,1], 'b*', linewidth=2.0, label="Simulation")
ax_reaction.plot(paper_experimental[:,0], paper_experimental[:,1], 'r*', linewidth=2.0, label="Experimental")

ax_reaction.grid(False)
ax_reaction.set_xlabel('x')
ax_reaction.set_ylabel('y')
ax_reaction.legend()
ax_reaction.set_aspect('equal', adjustable='box')


# Create a PolyData line
x = paper_simulation[:, 0]
y = paper_simulation[:, 1]
z = np.zeros_like(x)

# Create a PolyData line
xf = paper_experimental[:, 0]
yf = paper_experimental[:, 1]
xf = xf
zf = np.zeros_like(xf)

# Stack into (N, 3) array for line points

xc = paper_frame[:, 0]
yc = paper_frame[:, 1]
xc = xc
zc = np.zeros_like(xc)


line_points = np.column_stack((x, y, z))
line_points_f = np.column_stack((xf, yf, zf))
line_points_frame = np.column_stack((xc, yc, zc))

line = pv.lines_from_points(line_points)

# Create a plotter and add your mesh and the line
plotter = pv.Plotter()
plotter.add_mesh(specimen_4_Hminus16, scalars='phi')
plotter.add_mesh(line_points_frame, color='blue', line_width=10)
plotter.add_mesh(line_points_f, color='red', line_width=10, label='experimental')
plotter.add_mesh(line, color='black', line_width=10, label='simulation')

plotter.view_xy()
plotter.show()

plt.show()
Total running time of the script: (0 minutes 19.836 seconds)