
Note
Go to the end to download the full example code.
Compare energy solvers#
This script compares the results from variational, non-variational phase-field solvers, and Linear Elastic Fracture Mechanics (LEFM) solutions for a three-point bending problem. It loads and processes output data from each solver, including force-displacement curves, Lagrange multipliers, stiffness versus crack area (gamma), and other relevant quantities. The script generates and saves comparative plots to visualize the differences and similarities between the approaches. The following solution schemes are compared:
Variational phase-field solver Variational Approach
Non-variational phase-field solver Non-Variational Approach
LEFM analytical solution Three-Point Bending Specimen: Fracture and Fatigue Analysis
The results help assess the accuracy and behavior of the phase-field models relative to the classical LEFM approach.
Import necessary libraries#
import numpy as np
import matplotlib.pyplot as plt
import pyvista as pv
import os
import sys
import pandas as pd


sys.path.insert(0, os.path.abspath('../../'))
plt.style.use('../../graph.mplstyle')
import plot_config as pcfg

results_folder = "results_three_point"
if not os.path.exists(results_folder):
    os.makedirs(results_folder)
Import from phasefieldx package#
Gc = 0.0005
B = 1.0
Load LEFM results#
SCHEME_1 = np.loadtxt("../LEFM/results_three_point/results.lefm", delimiter="\t", skiprows=1)
a_lefm = SCHEME_1[:,0]
k_lefm = SCHEME_1[:,1]
c_lefm = 1/k_lefm
dCda_lefm = SCHEME_1[:,3]

SCHEME_1 = np.loadtxt("../LEFM/results_three_point/a0_02.lefm_problem", delimiter="\t", skiprows=1)
h=1/100
l=0.03
u_lefm = SCHEME_1[:,1]
p_lefm = SCHEME_1[:,2]
label_lefm = r"LEFM"
color_lefm = pcfg.color_black
Load Results: non variational#
results_nonvar = pd.read_csv("../Phase_Field_Three_Point/results_non_variational/results.pff", delimiter="\t", comment="#", header=0)
results_nonvar_bourdin = pd.read_csv("../Phase_Field_Three_Point/results_non_variational/results_corrected_bourdin.pff", delimiter="\t", comment="#", header=0)
label_nonvar = r"Non-Variational"
color_nonvar = pcfg.color_orangered
Load Results: variational#
results_var = pd.read_csv("../Phase_Field_Three_Point/results_variational/results.pff", delimiter="\t", comment="#", header=0)
results_var_equivalent = pd.read_csv("../Phase_Field_Three_Point/results_variational/results_equivalent.pff", delimiter="\t", comment="#", header=0)
results_var_equivalent_bourdin = pd.read_csv("../Phase_Field_Three_Point/results_variational/results_equivalent_bourdin.pff", delimiter="\t", comment="#", header=0)
label_var = r"Variational"
color_var = pcfg.color_blue


# Proportional marker distribution
markevery_1 = max(1, len(results_nonvar["displacement"])//20)
markevery_2 = max(1, len(results_var["displacement"])//20)
markevery_a1 = max(1, len(results_nonvar["displacement"])//20)
markevery_a2 = max(1, len(results_var["displacement"])//20)
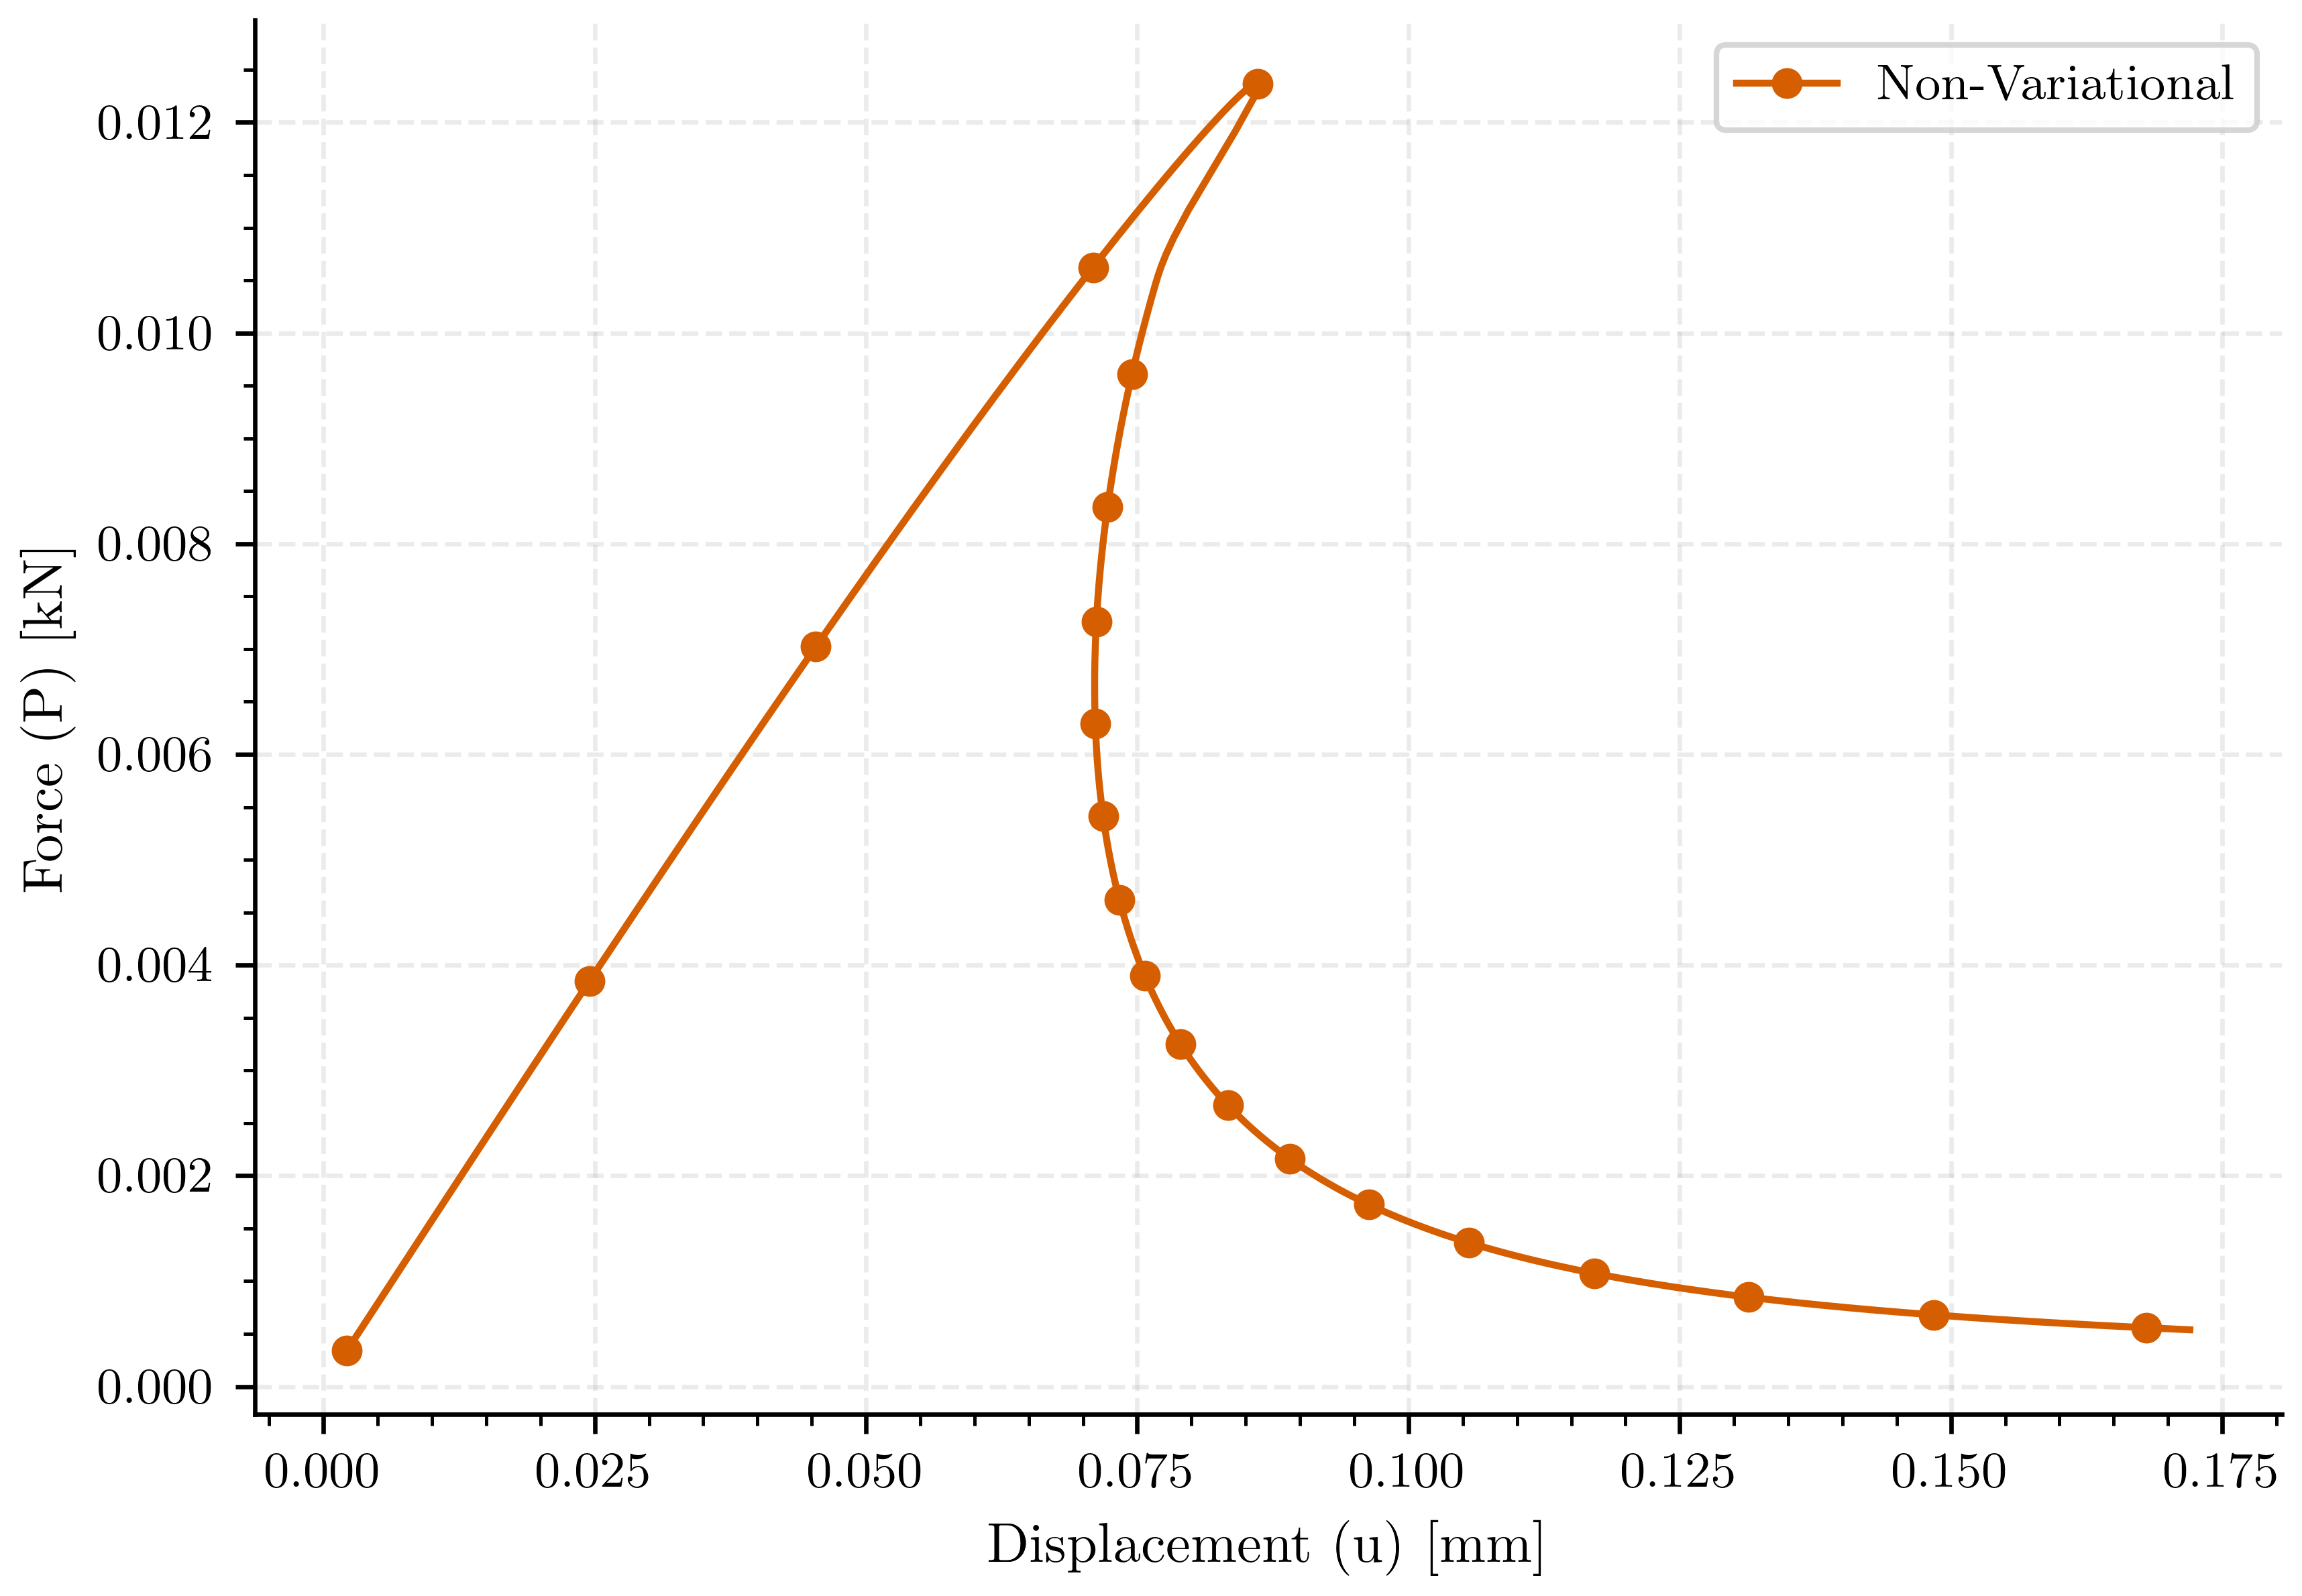
Plot: Non-Variational Force vs Vertical Displacement#
fig, ax_reaction = plt.subplots()
ax_reaction.plot(results_nonvar["displacement"], results_nonvar["force"], color=color_nonvar, linestyle='-', label=label_nonvar, markevery=markevery_1, marker='o')
ax_reaction.set_xlabel(pcfg.displacement_label)
ax_reaction.set_ylabel(pcfg.force_label)
ax_reaction.legend()
plt.savefig(os.path.join(results_folder, "nonvariational_displacement_vs_force"))
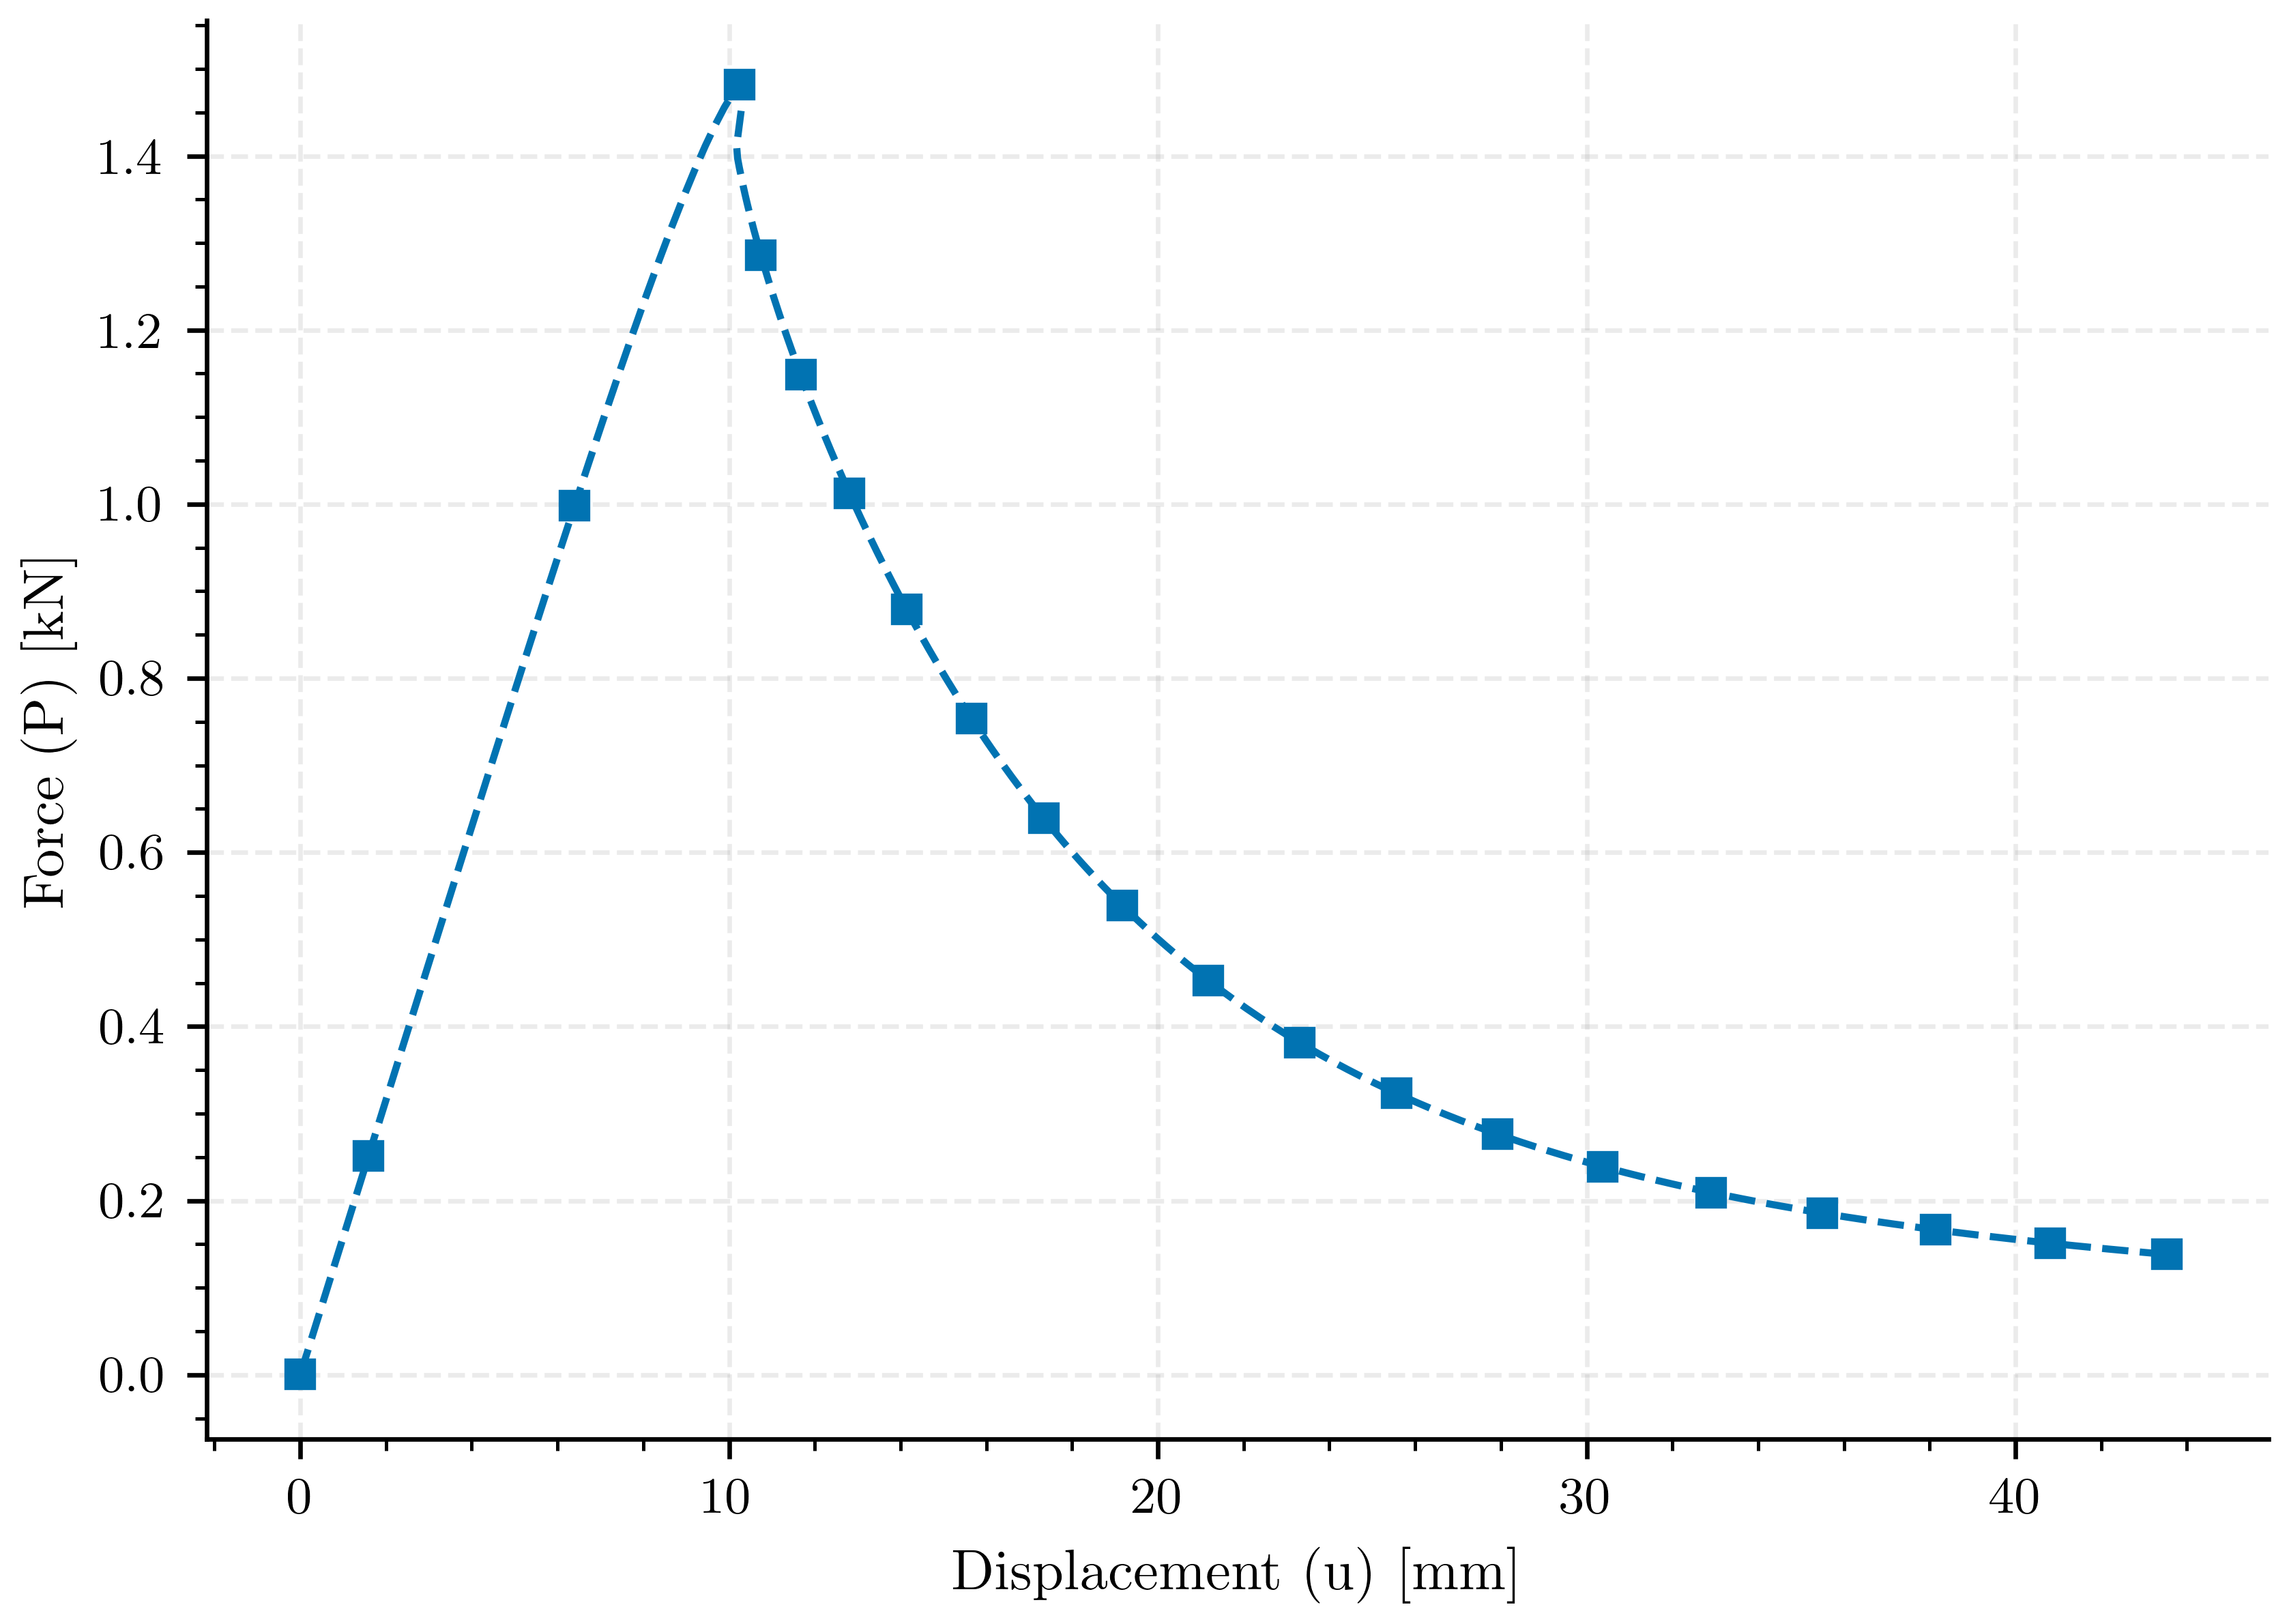
Plot: Variational Force vs Vertical Displacement#
fig, ax_reaction = plt.subplots()
ax_reaction.plot(results_var["displacement"], results_var["force"], color=color_var, linestyle='--', label=label_var, markevery=markevery_2, marker='s')
ax_reaction.set_xlabel(pcfg.displacement_label)
ax_reaction.set_ylabel(pcfg.force_label)
# ax_reaction.legend()
plt.savefig(os.path.join(results_folder, "variational_displacement_vs_force"))
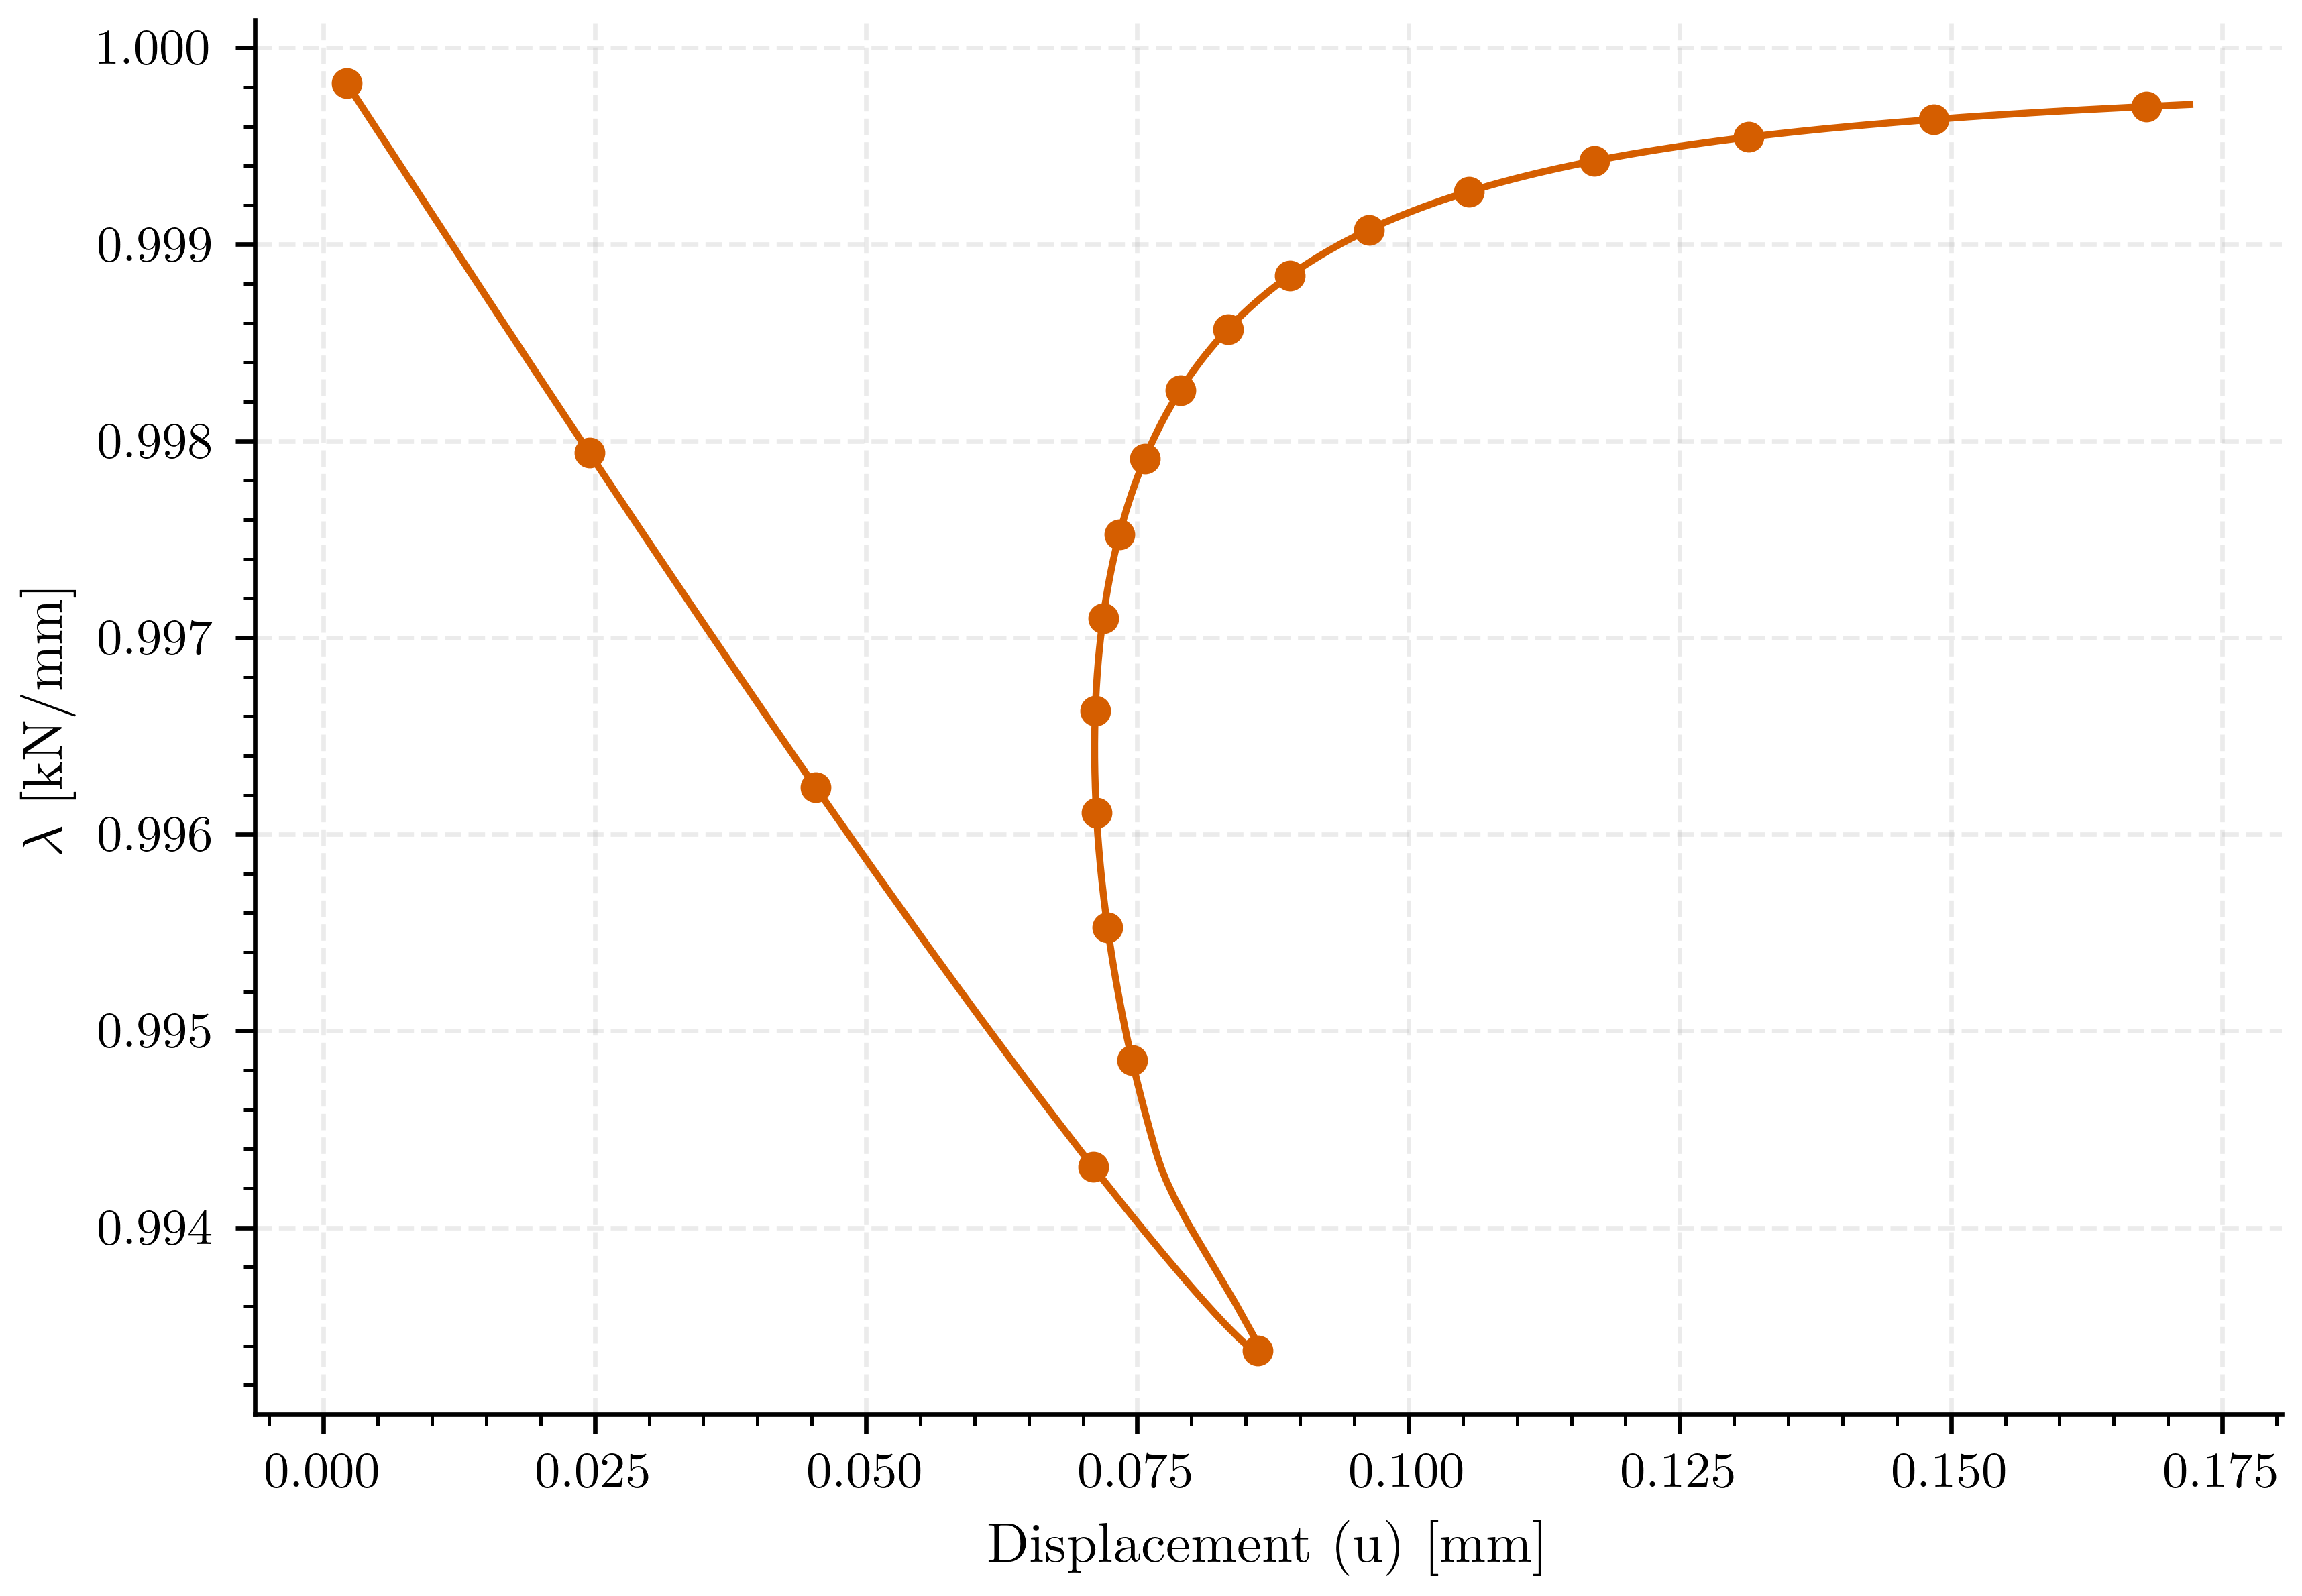
Plot: Lagrange Multiplier vs Displacement (Non-Variational)#
fig, ax_lambda = plt.subplots()
ax_lambda.plot(results_nonvar["displacement"], results_nonvar["lambda"], color=color_nonvar, linestyle='-', label=label_nonvar, markevery=markevery_1, marker='o')
ax_lambda.set_xlabel(pcfg.displacement_label)
ax_lambda.set_ylabel(pcfg.lambda_label)
# ax_lambda.legend()
plt.savefig(os.path.join(results_folder, "nonvariational_displacement_vs_lambda"))
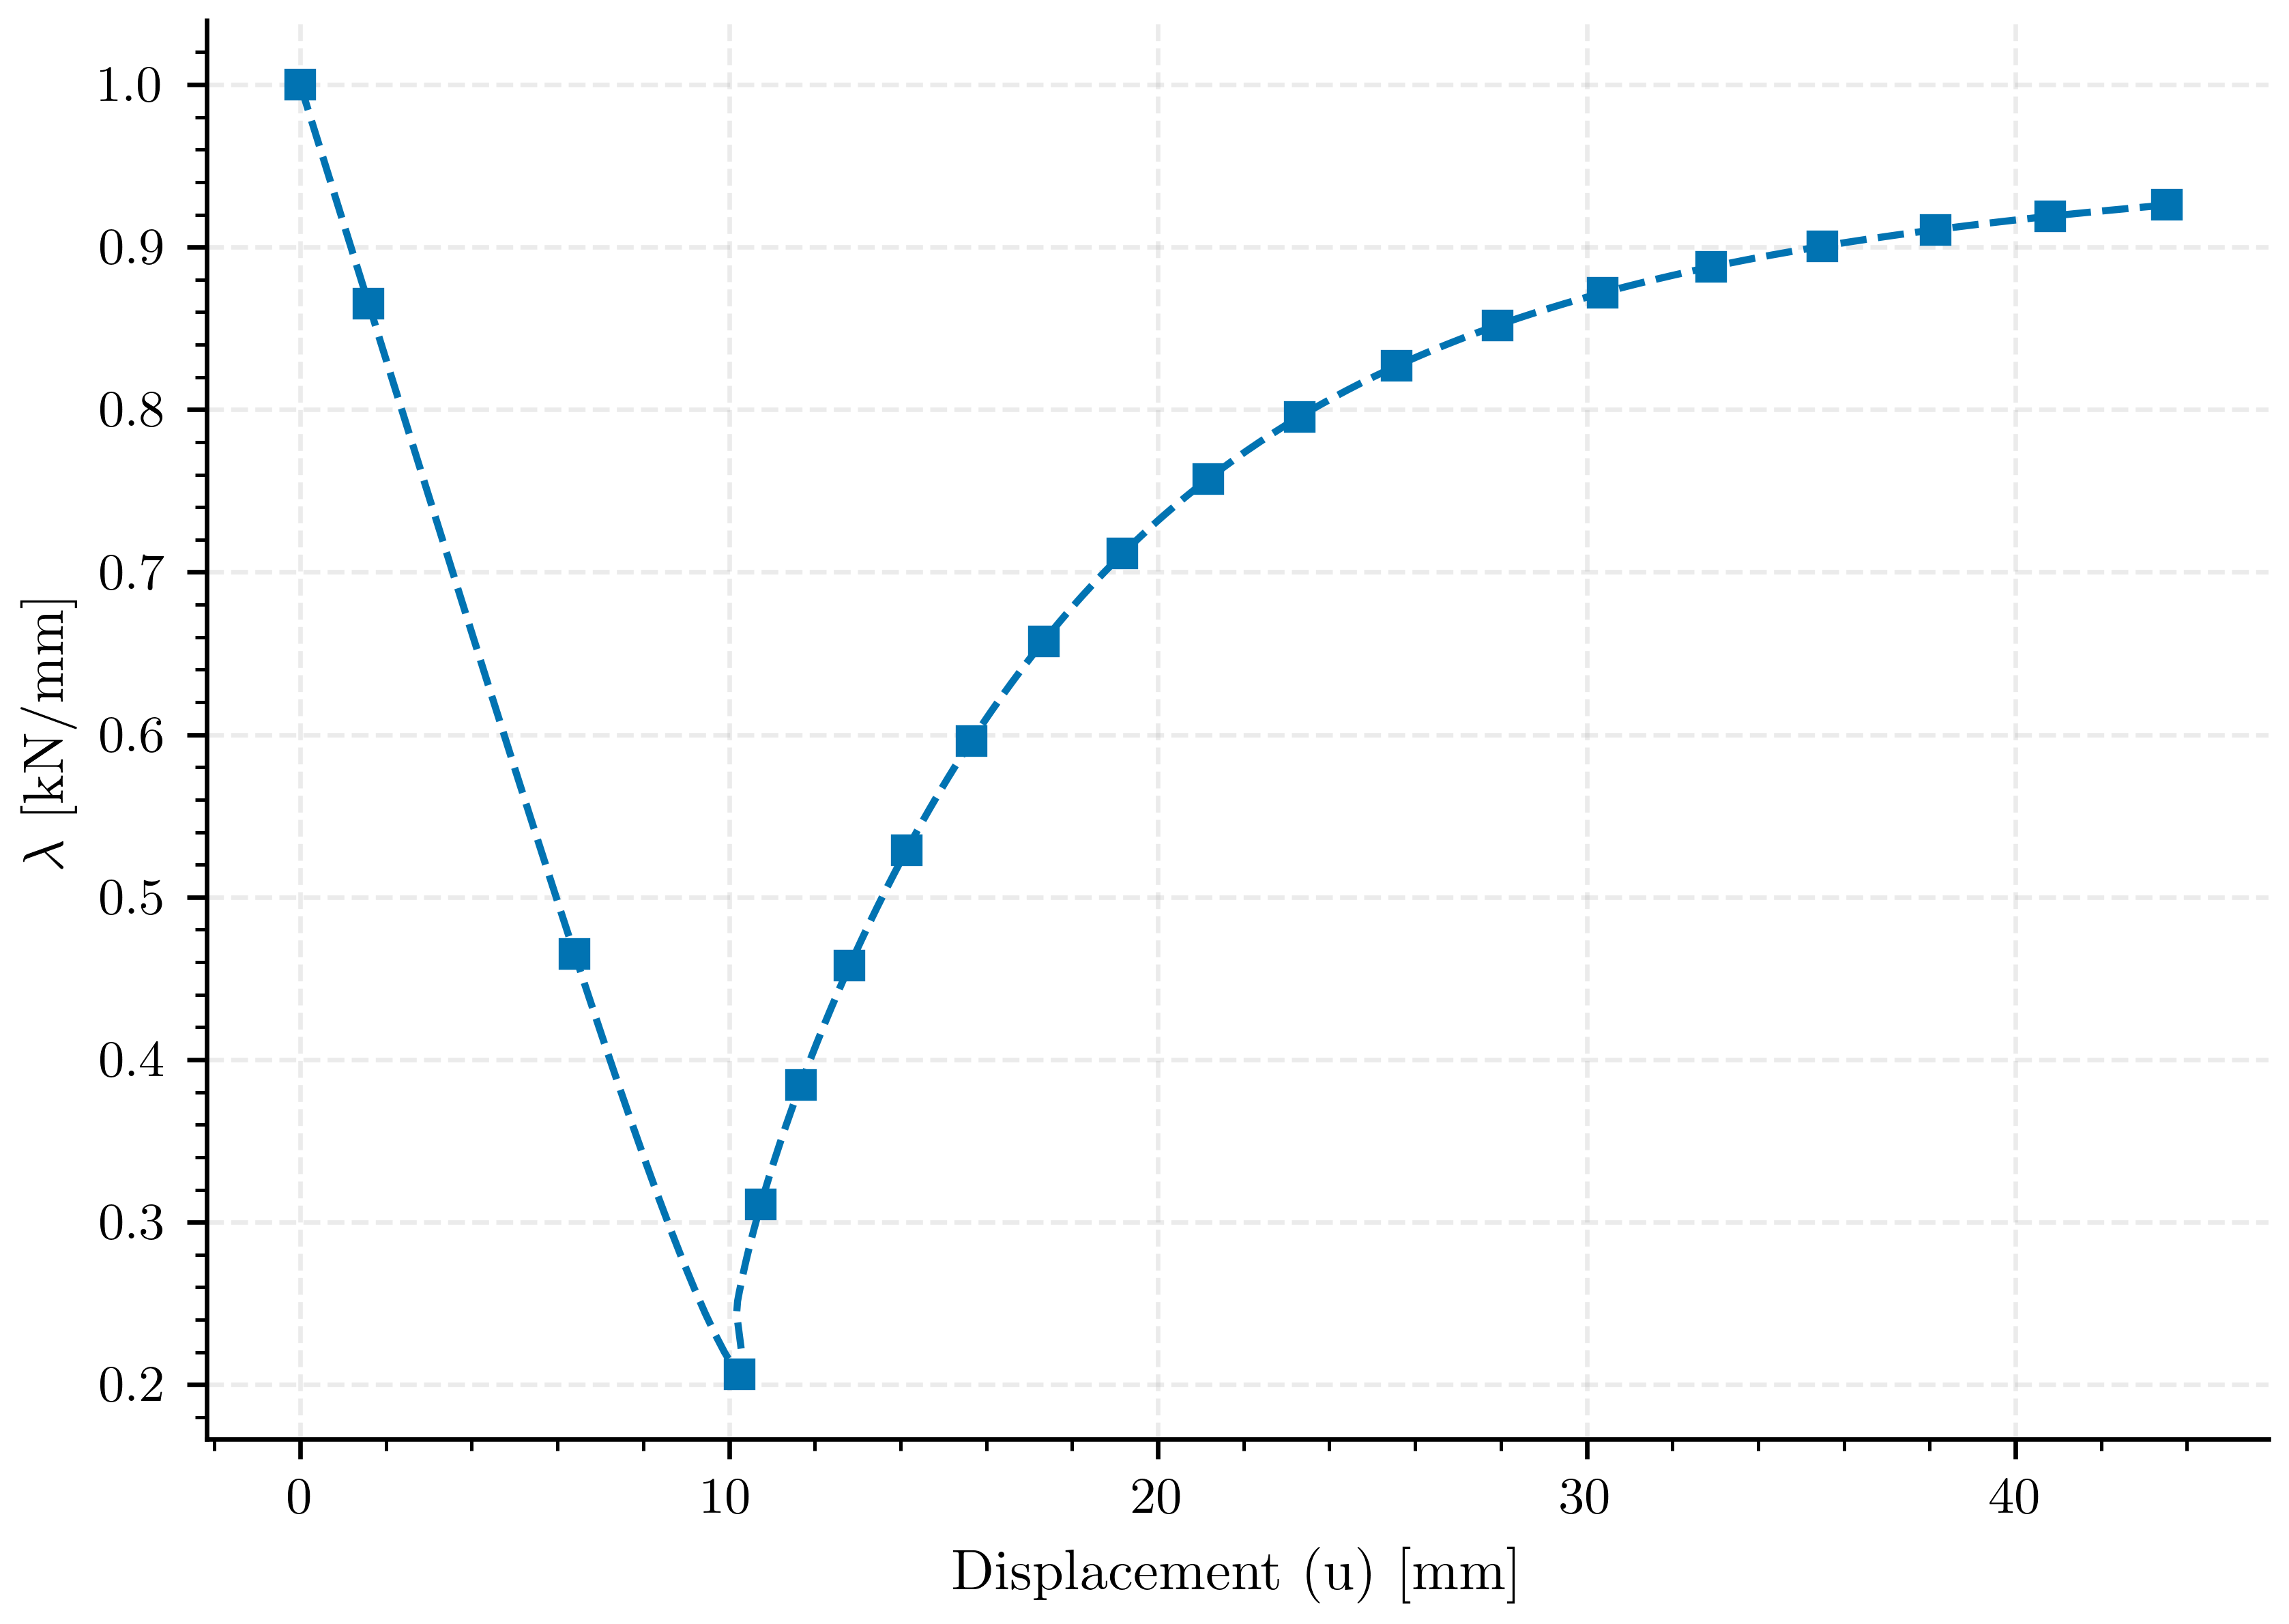
Plot: Lagrange Multiplier vs Displacement (Variational)#
fig, ax_lambda = plt.subplots()
ax_lambda.plot(results_var["displacement"], results_var["lambda"], color=color_var, linestyle='--', label=label_var, markevery=markevery_2, marker='s')
ax_lambda.set_xlabel(pcfg.displacement_label)
ax_lambda.set_ylabel(pcfg.lambda_label)
# ax_lambda.legend()
plt.savefig(os.path.join(results_folder, "variational_displacement_vs_lambda"))
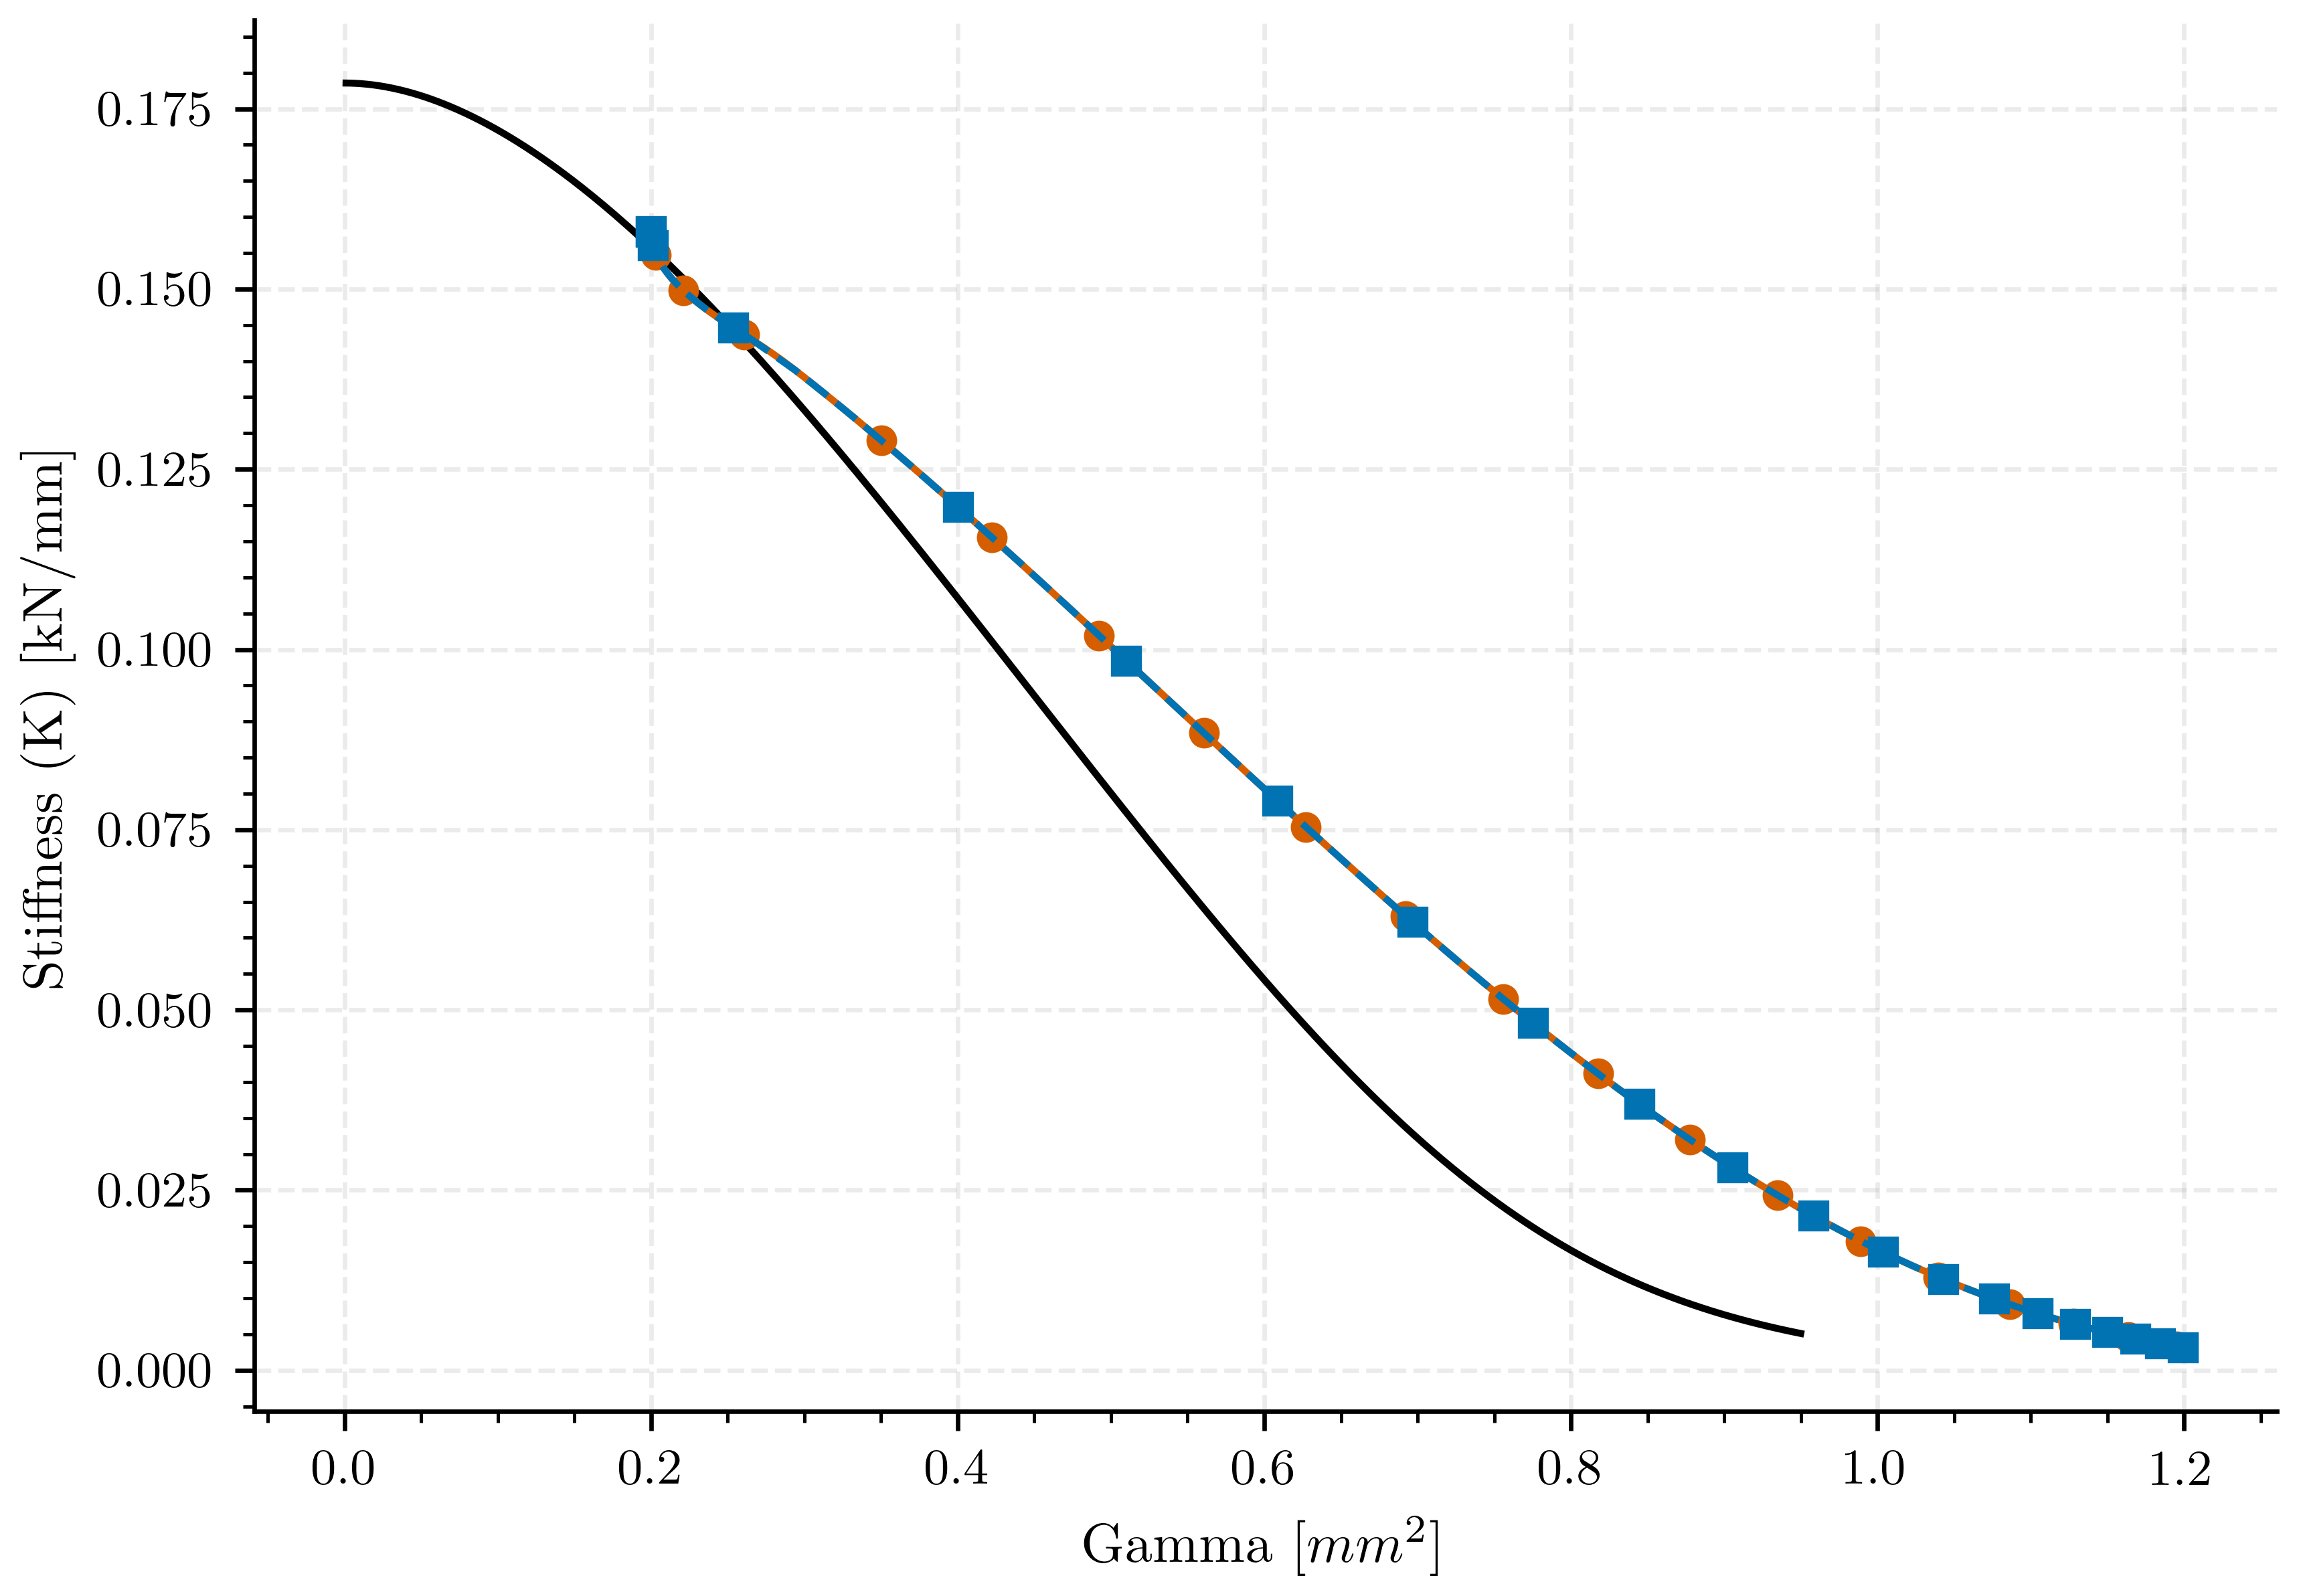
Plot: Stiffness vs Crack Area (Gamma)#
fig, ax_stiffness = plt.subplots()

ax_stiffness.plot(a_lefm, k_lefm, color=color_lefm, linestyle='-', label=label_lefm, markevery=markevery_a1)
ax_stiffness.plot(results_nonvar["gamma"], results_nonvar["stiffness"], color=color_nonvar, linestyle='-', label=label_nonvar, markevery=markevery_a1, marker='o')
ax_stiffness.plot(results_var["gamma"], results_var["stiffness"], color=color_var, linestyle='--', label=label_var, markevery=markevery_a2, marker='s')

ax_stiffness.set_xlabel(pcfg.gamma_label)
ax_stiffness.set_ylabel(pcfg.stiffness_label)
# ax_stiffness.legend()

# Save the axis limits
# ax_stiffness.set_xlim(-0.06, 1.26)
# ax_stiffness.set_ylim(-0.004, 0.2)

plt.savefig(os.path.join(results_folder, "compare_gamma_vs_stiffness"))
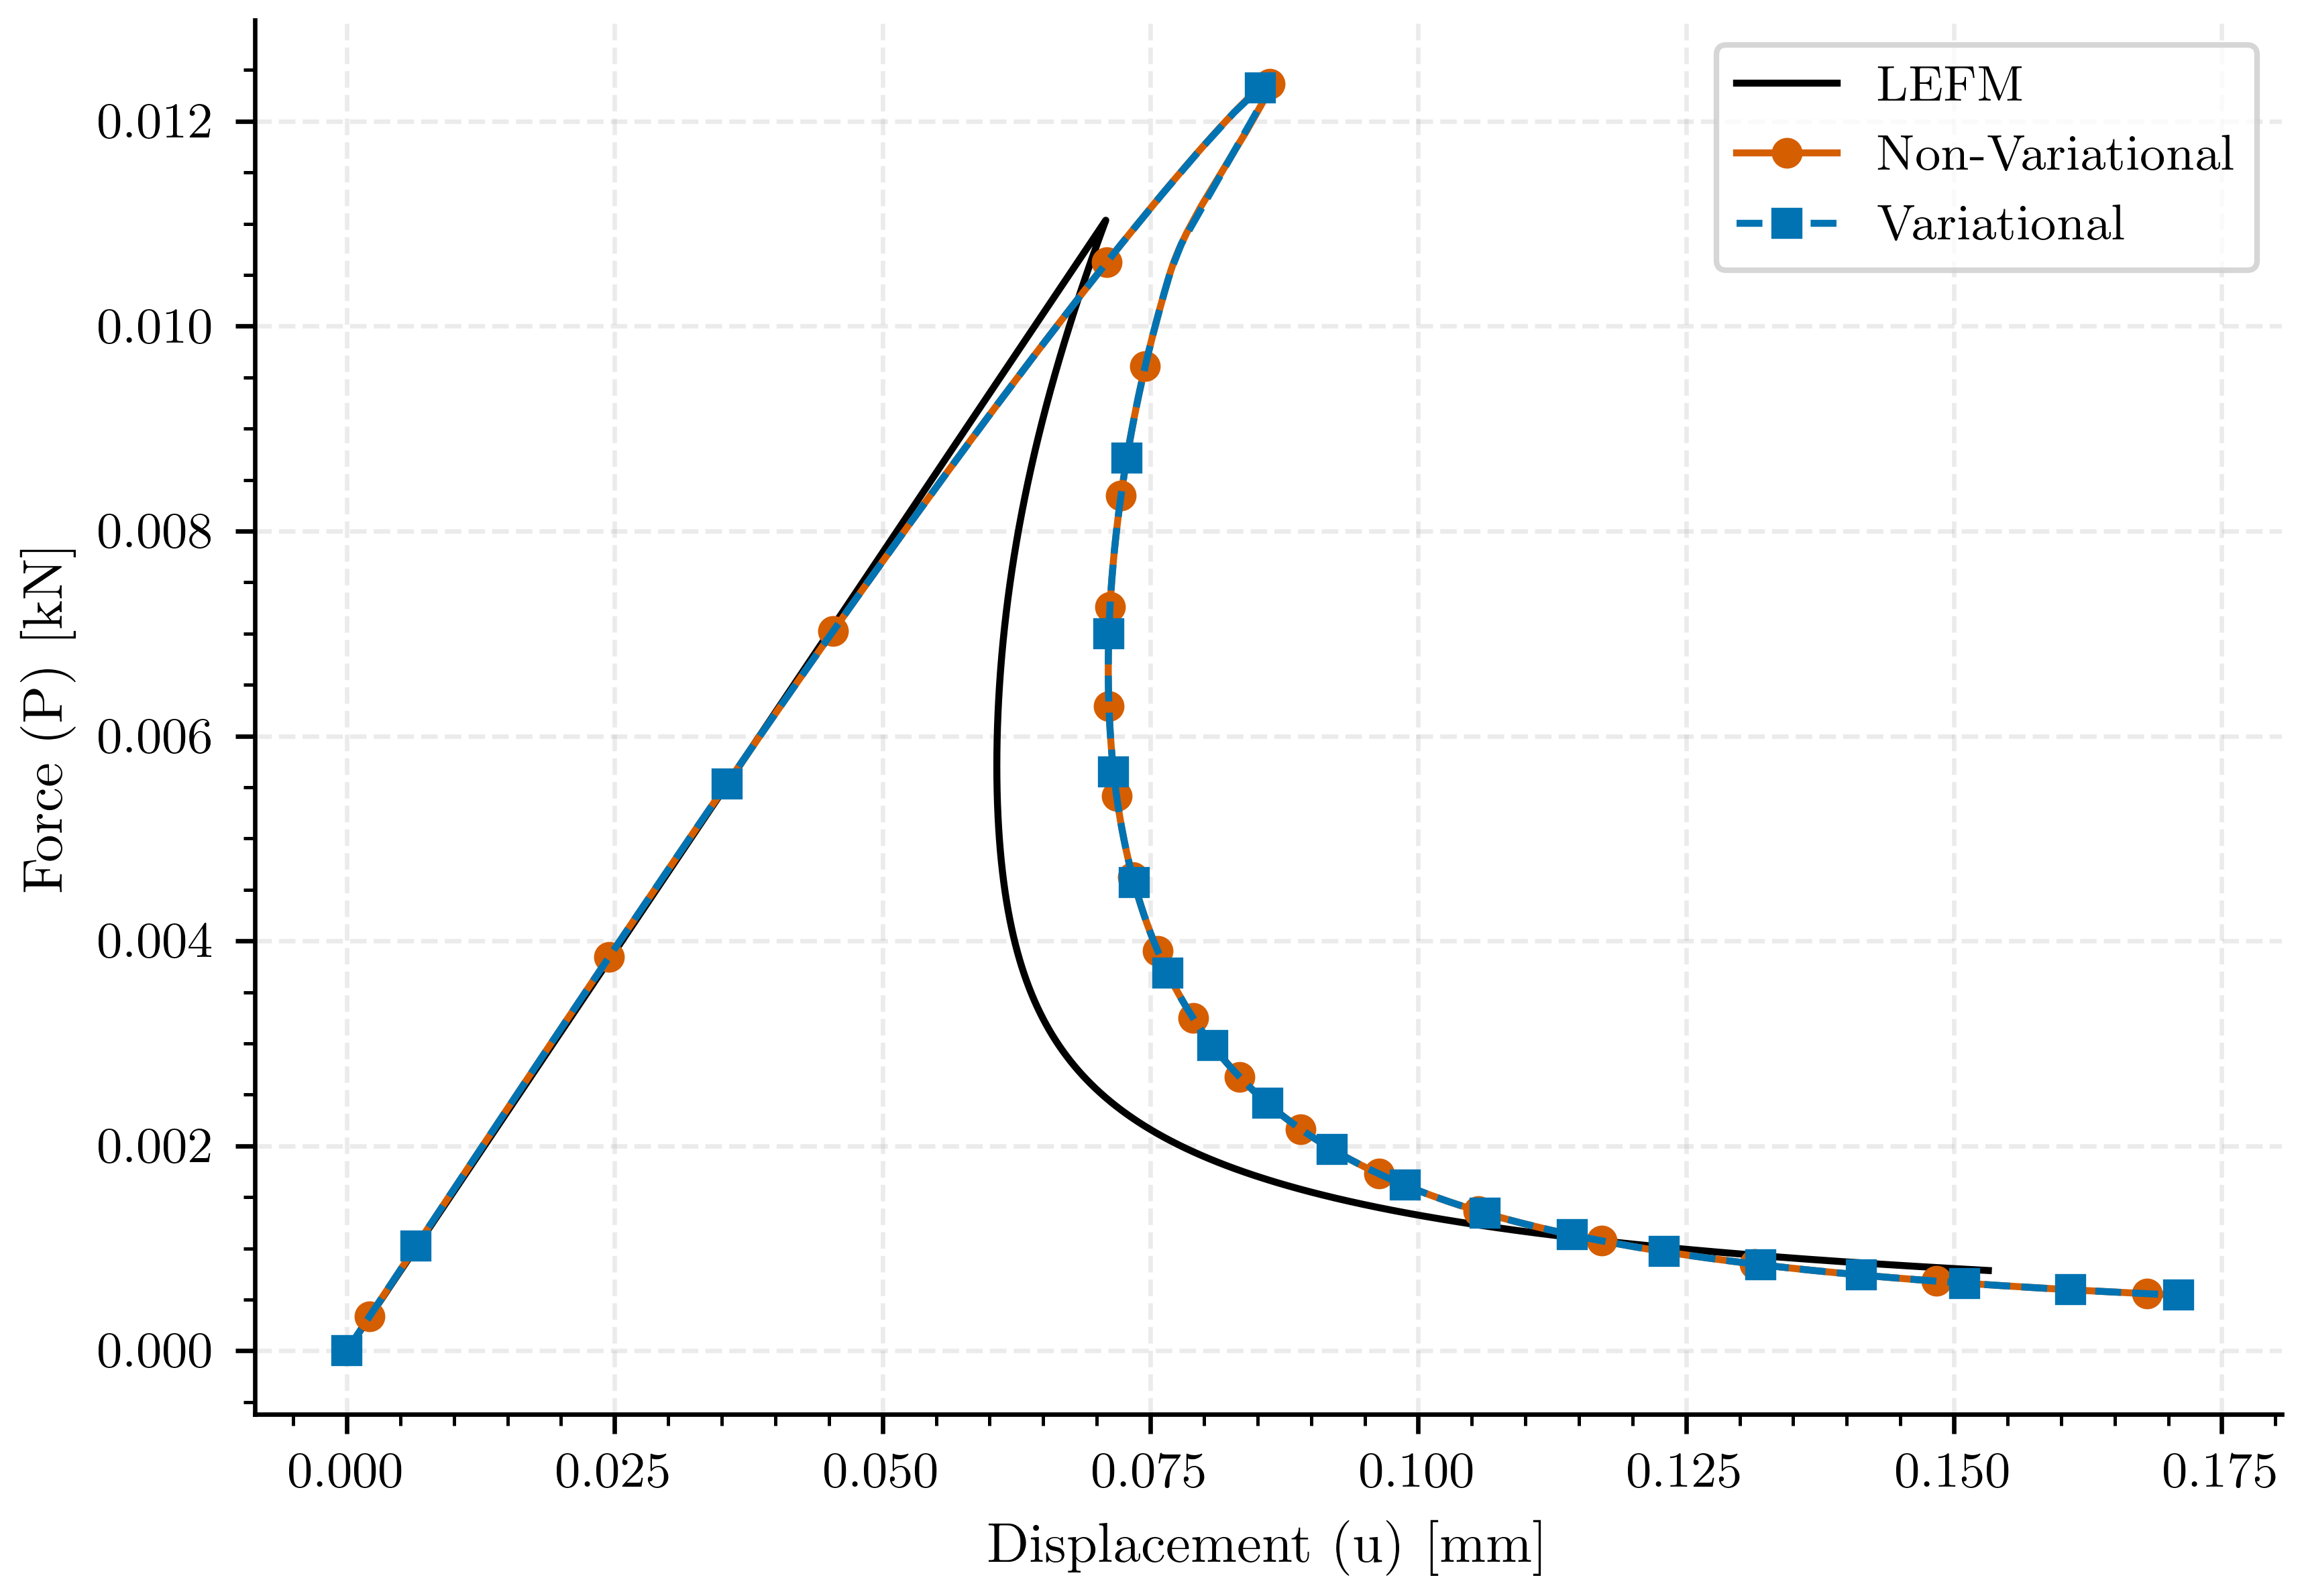
Plot: Corrected Force vs Displacement (Comparison)#
fig, ax_compare = plt.subplots()
ax_compare.plot(u_lefm, p_lefm, color=color_lefm, linestyle='-', label=label_lefm, markevery=markevery_1)
ax_compare.plot(results_nonvar["displacement"], results_nonvar["force"], color=color_nonvar, linestyle='-', label=label_nonvar, markevery=markevery_1, marker='o')
ax_compare.plot(results_var_equivalent["displacement"], results_var_equivalent["force"], color=color_var, linestyle='--', label=label_var, markevery=markevery_2, marker='s')
ax_compare.set_xlabel(pcfg.displacement_label)
ax_compare.set_ylabel(pcfg.force_label)

ax_compare.legend()
plt.savefig(os.path.join(results_folder, "compare_displacement_vs_force"))


plt.show()
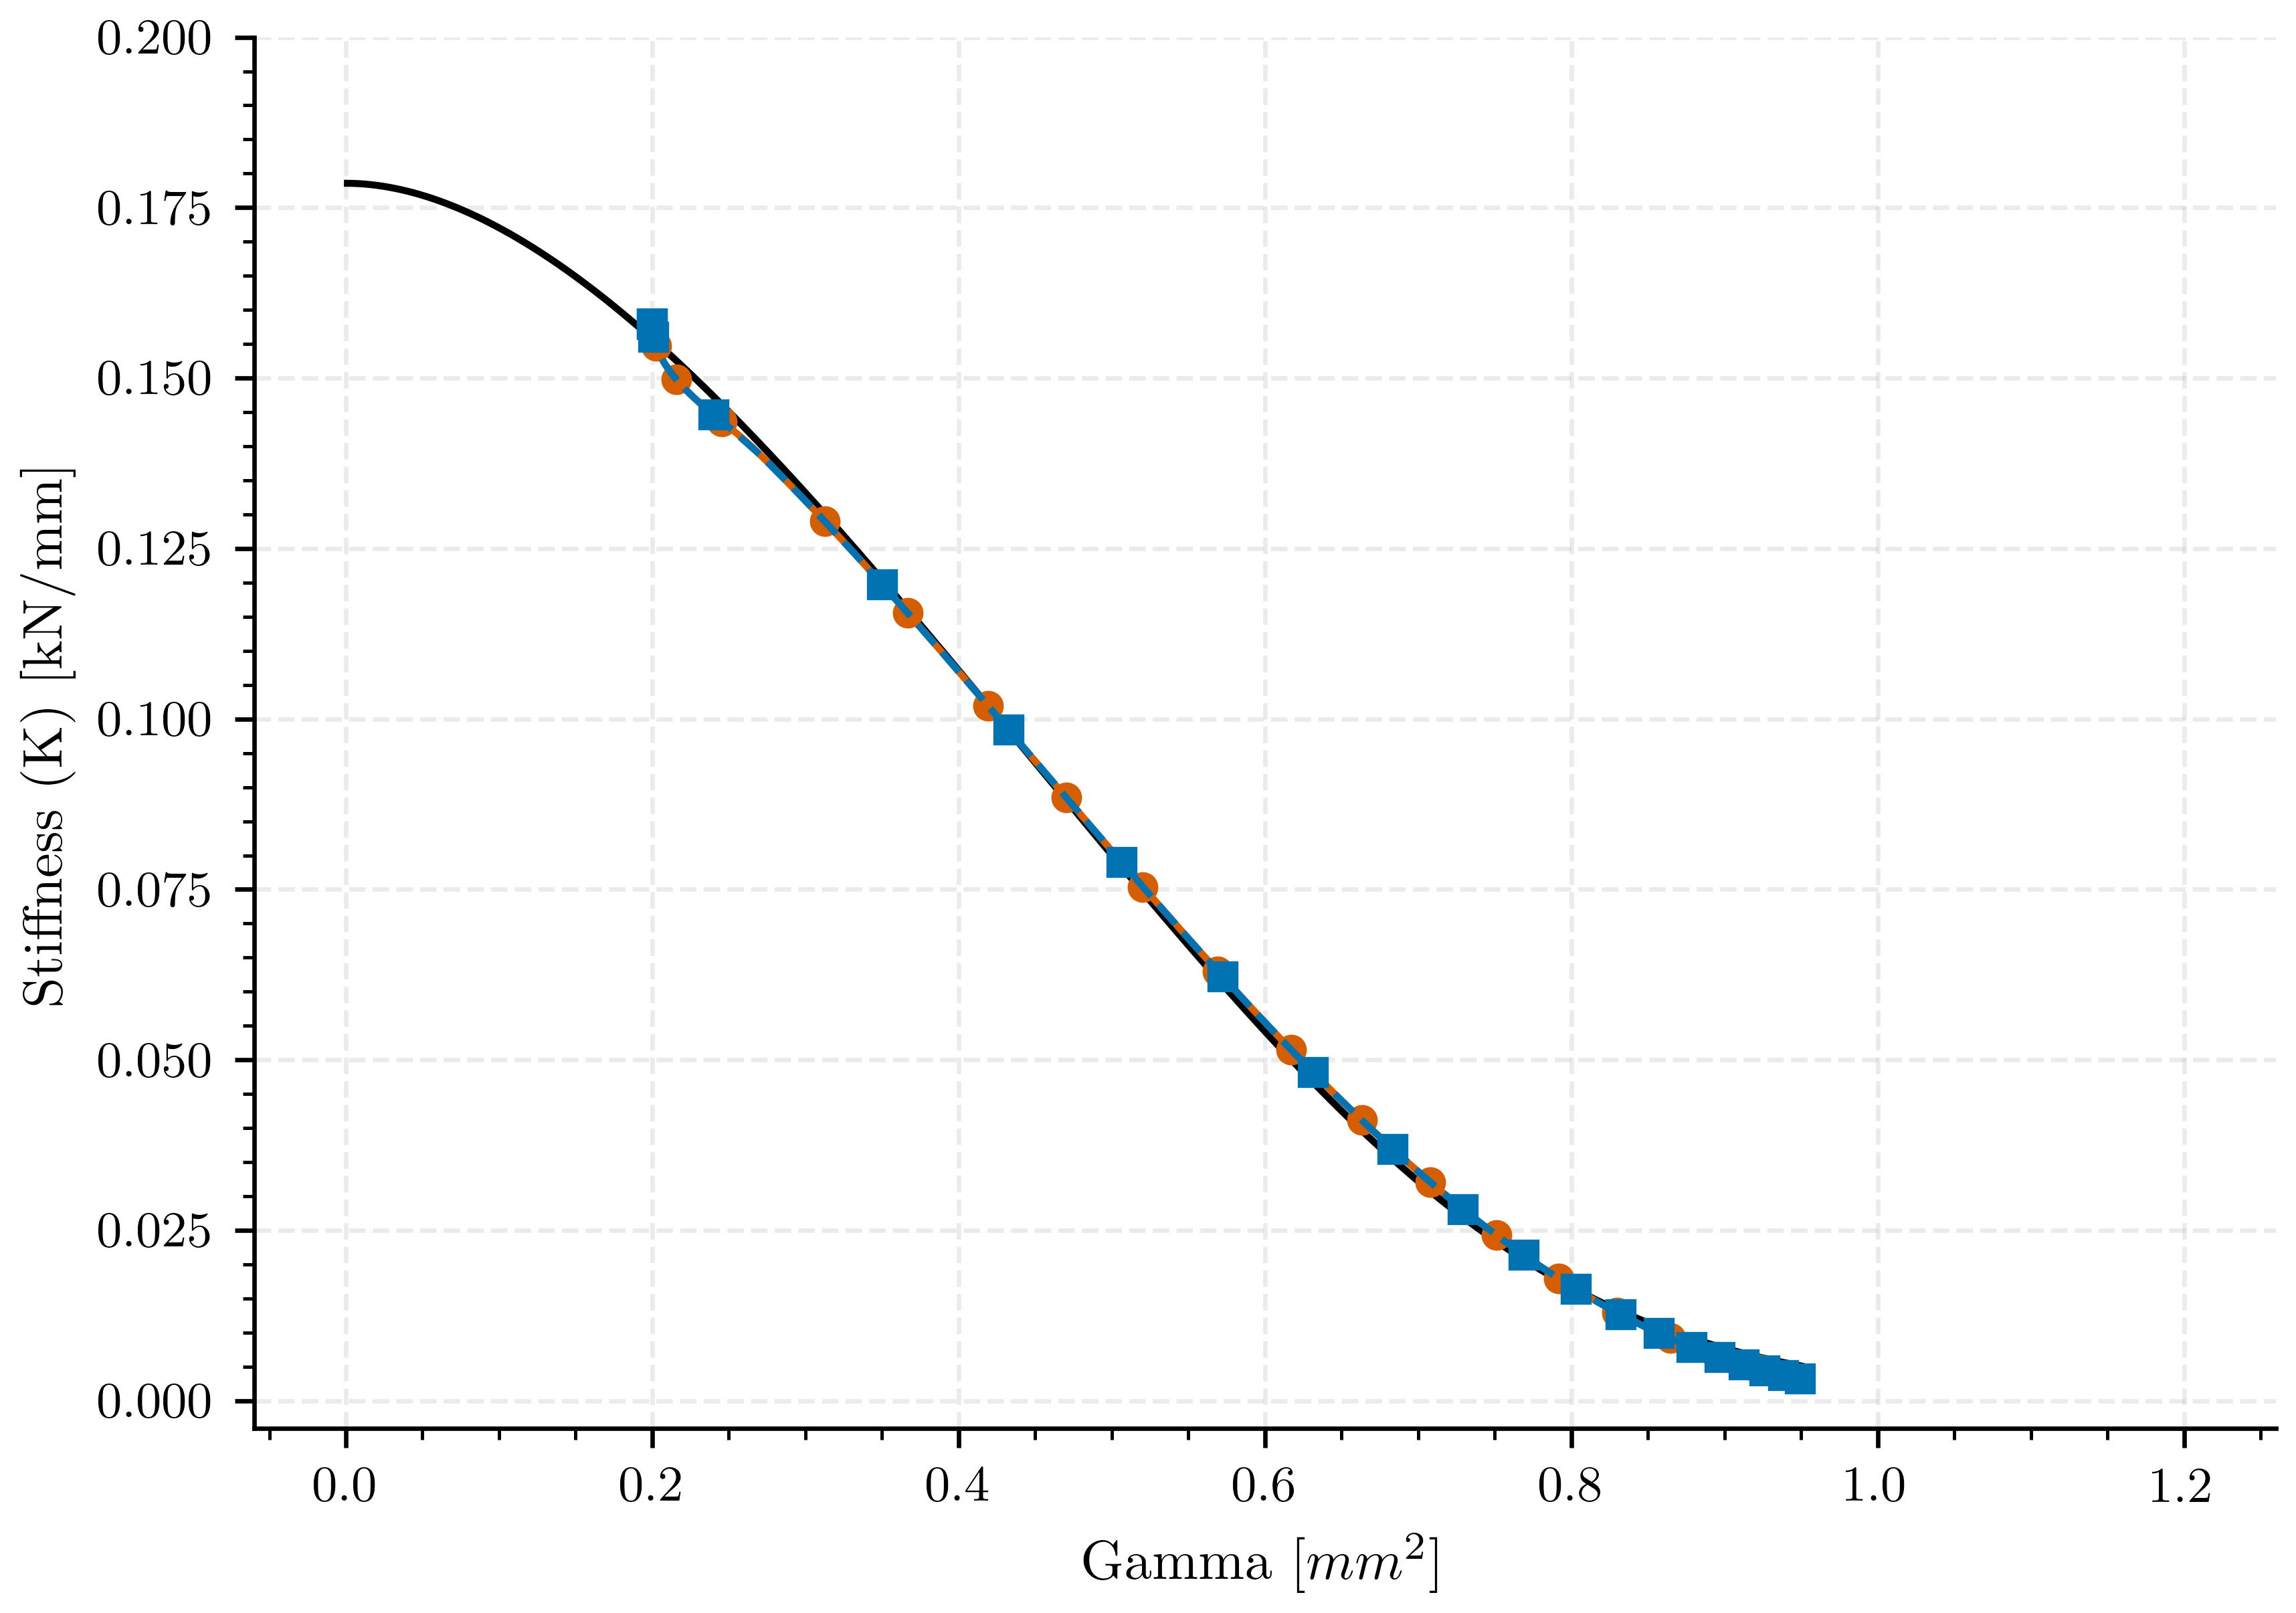
Plot: Stiffness vs Crack Area (Gamma)#
a0 = 0.2
fig, ax_stiffness = plt.subplots()

ax_stiffness.plot(a_lefm, k_lefm, color=color_lefm, linestyle='-', label=label_lefm, markevery=markevery_a1)
ax_stiffness.plot(results_nonvar_bourdin["gamma"], results_nonvar_bourdin["stiffness"], color=color_nonvar, linestyle='-', label=label_nonvar, markevery=markevery_a1, marker='o')
ax_stiffness.plot(results_var_equivalent_bourdin["gamma"], results_var_equivalent_bourdin["stiffness"],
                  color=color_var, linestyle='--', label=label_var, markevery=markevery_a2, marker='s')

ax_stiffness.set_xlim(-0.06, 1.26)
ax_stiffness.set_ylim(-0.004, 0.2)
ax_stiffness.set_xlabel(pcfg.gamma_label)
ax_stiffness.set_ylabel(pcfg.stiffness_label)
# ax_stiffness.legend()
plt.savefig(os.path.join(results_folder, "compare_gamma_vs_stiffness_corrected_Gc"))
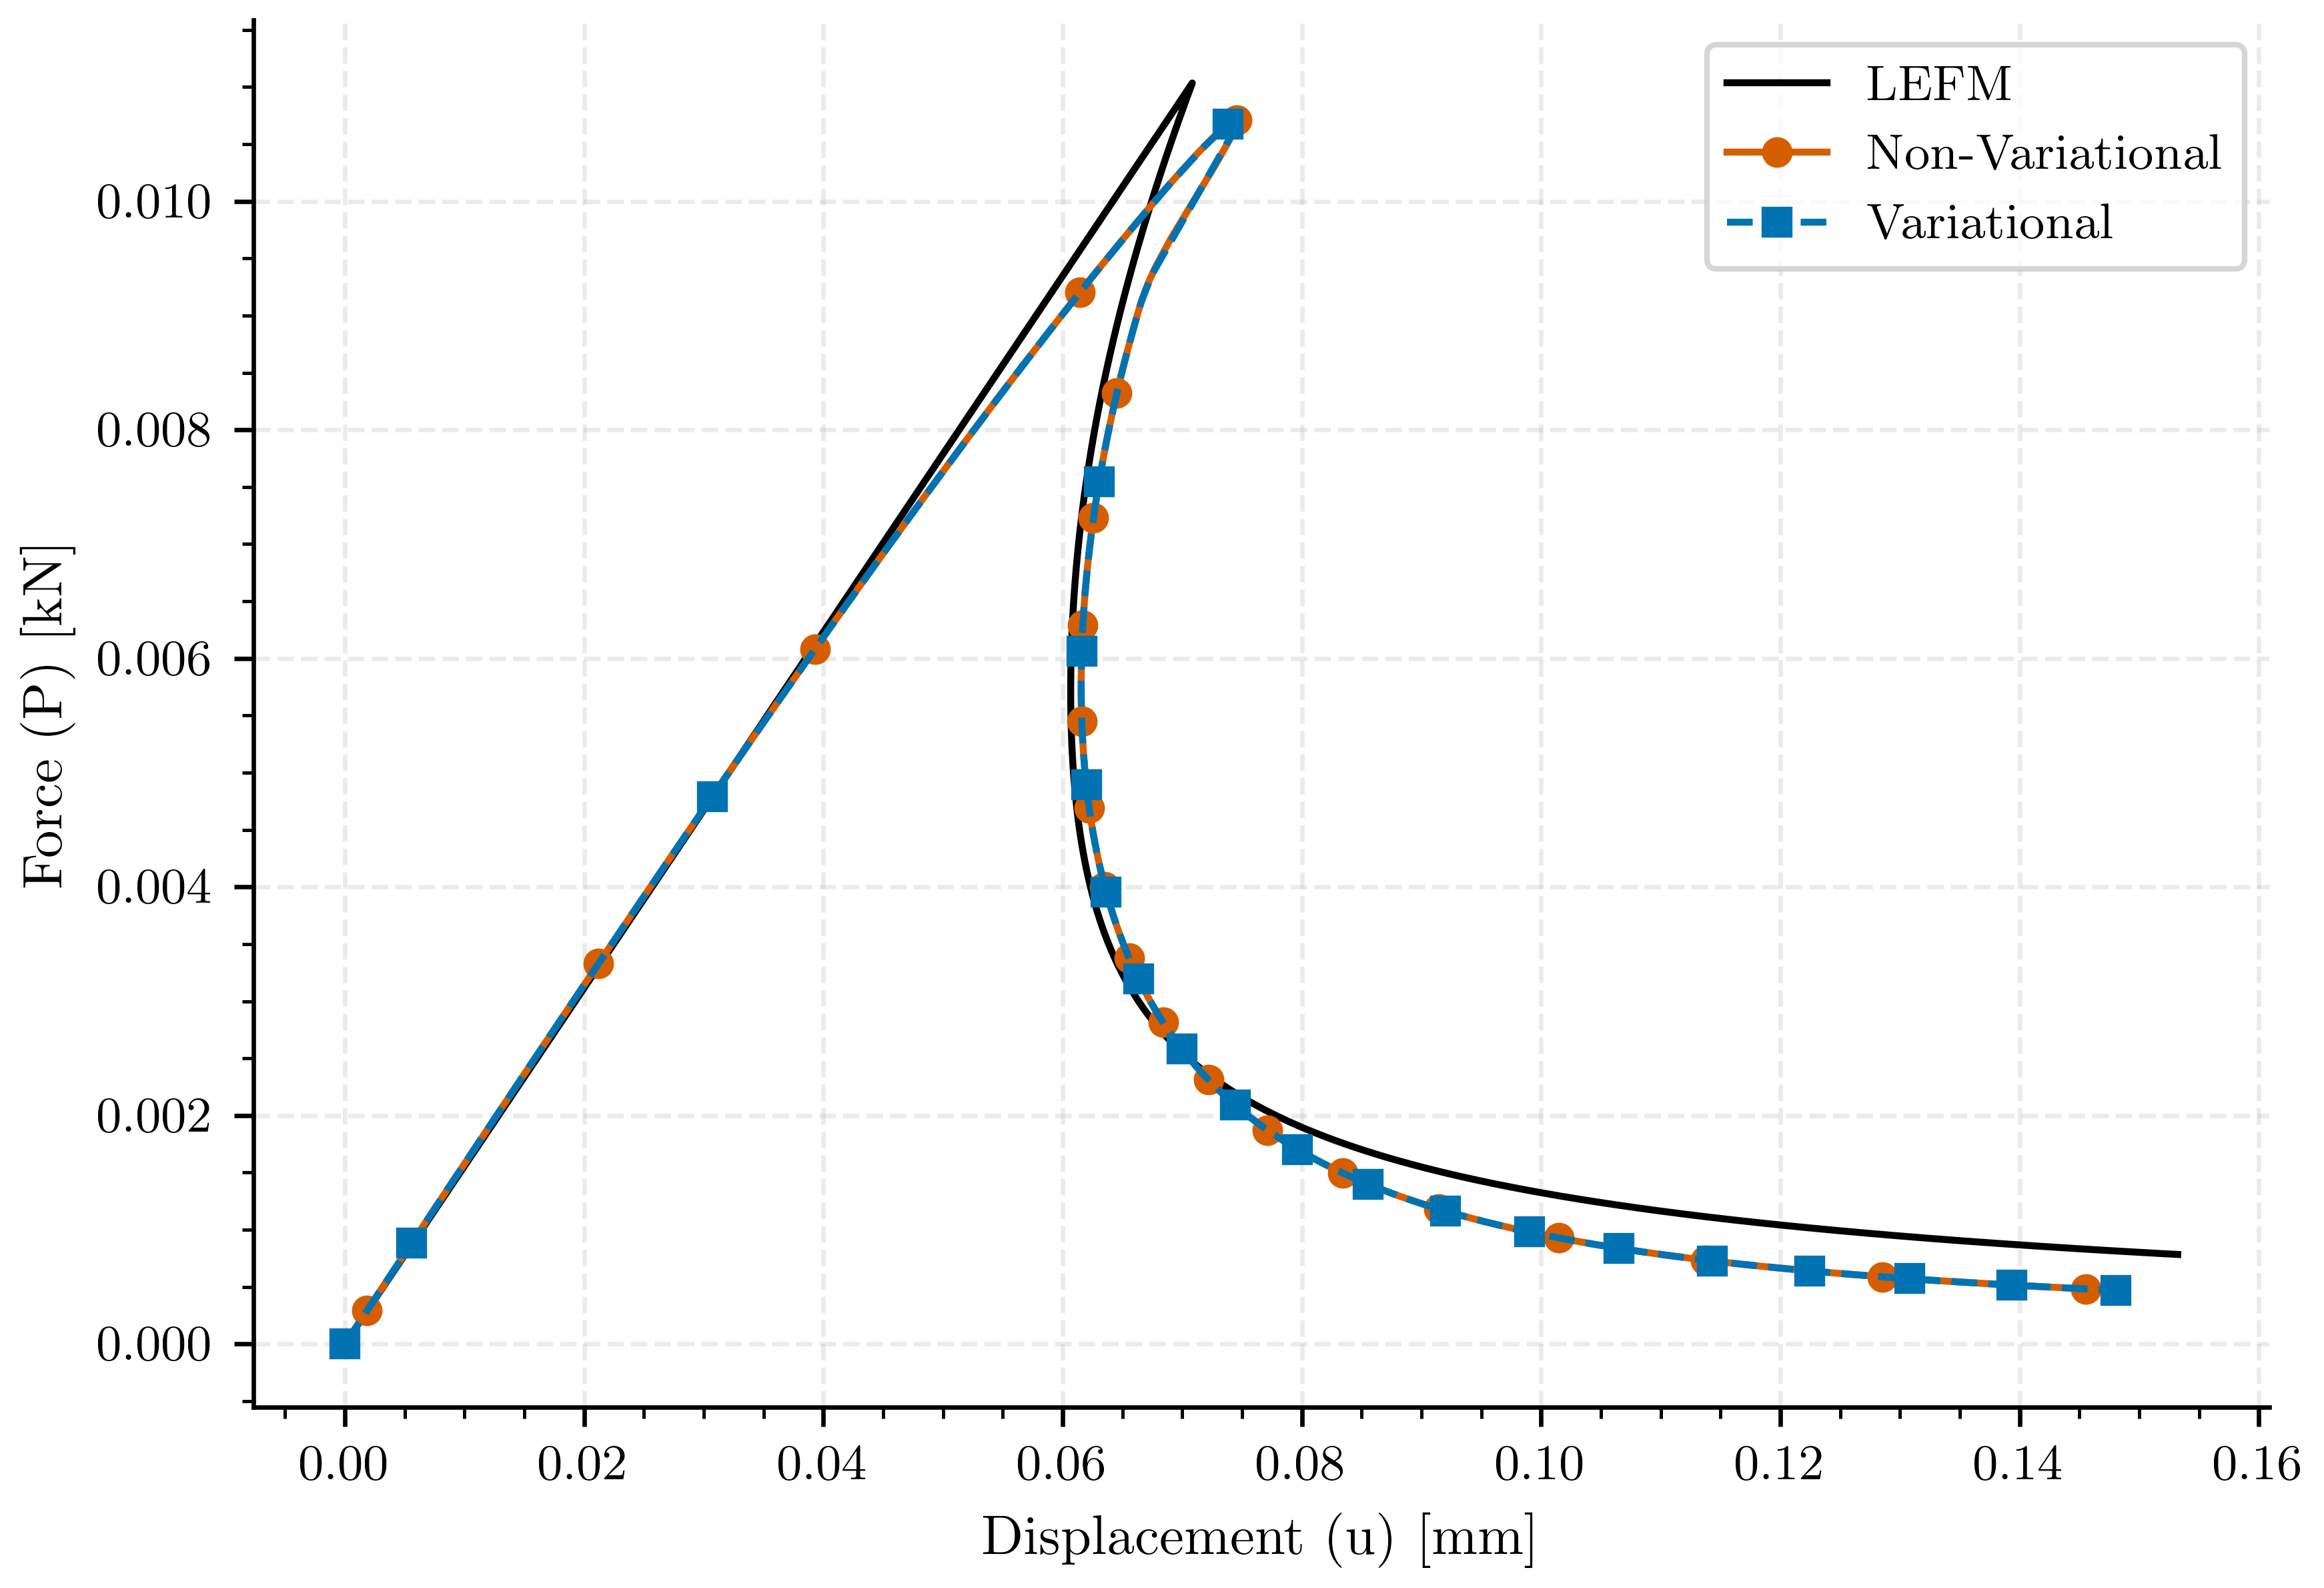
Plot: Corrected Force vs Displacement (Comparison)#
fig, ax_compare = plt.subplots()

ax_compare.plot(u_lefm, p_lefm, color=color_lefm, linestyle='-', label=label_lefm, markevery=markevery_1)
ax_compare.plot(results_nonvar_bourdin["displacement"], results_nonvar_bourdin["force"], color=color_nonvar, linestyle='-', label=label_nonvar, markevery=markevery_1, marker='o')
ax_compare.plot(results_var_equivalent_bourdin["displacement"], results_var_equivalent_bourdin["force"], color=color_var, linestyle='--', label=label_var, markevery=markevery_2, marker='s')
ax_compare.set_xlabel(pcfg.displacement_label)
ax_compare.set_ylabel(pcfg.force_label)
ax_compare.legend()
plt.savefig(os.path.join(results_folder, "compare_displacement_vs_force_corrected_Gc"))


plt.show()
Total running time of the script: (0 minutes 8.776 seconds)