Note
Go to the end to download the full example code.
Visualization of Experimental and Simulation Data from Wagner#
This script visualizes data from the paper Wagner[1].
Import necessary libraries#
import numpy as np
import matplotlib.pyplot as plt
import sys
import os
sys.path.insert(0, os.path.abspath('../../'))
plt.style.use('../../graph.mplstyle')
import plot_config as pcfg
import pandas as pd
Load data from the paper#
The following lines load the data from text files corresponding to the experimental fatigue analysis.
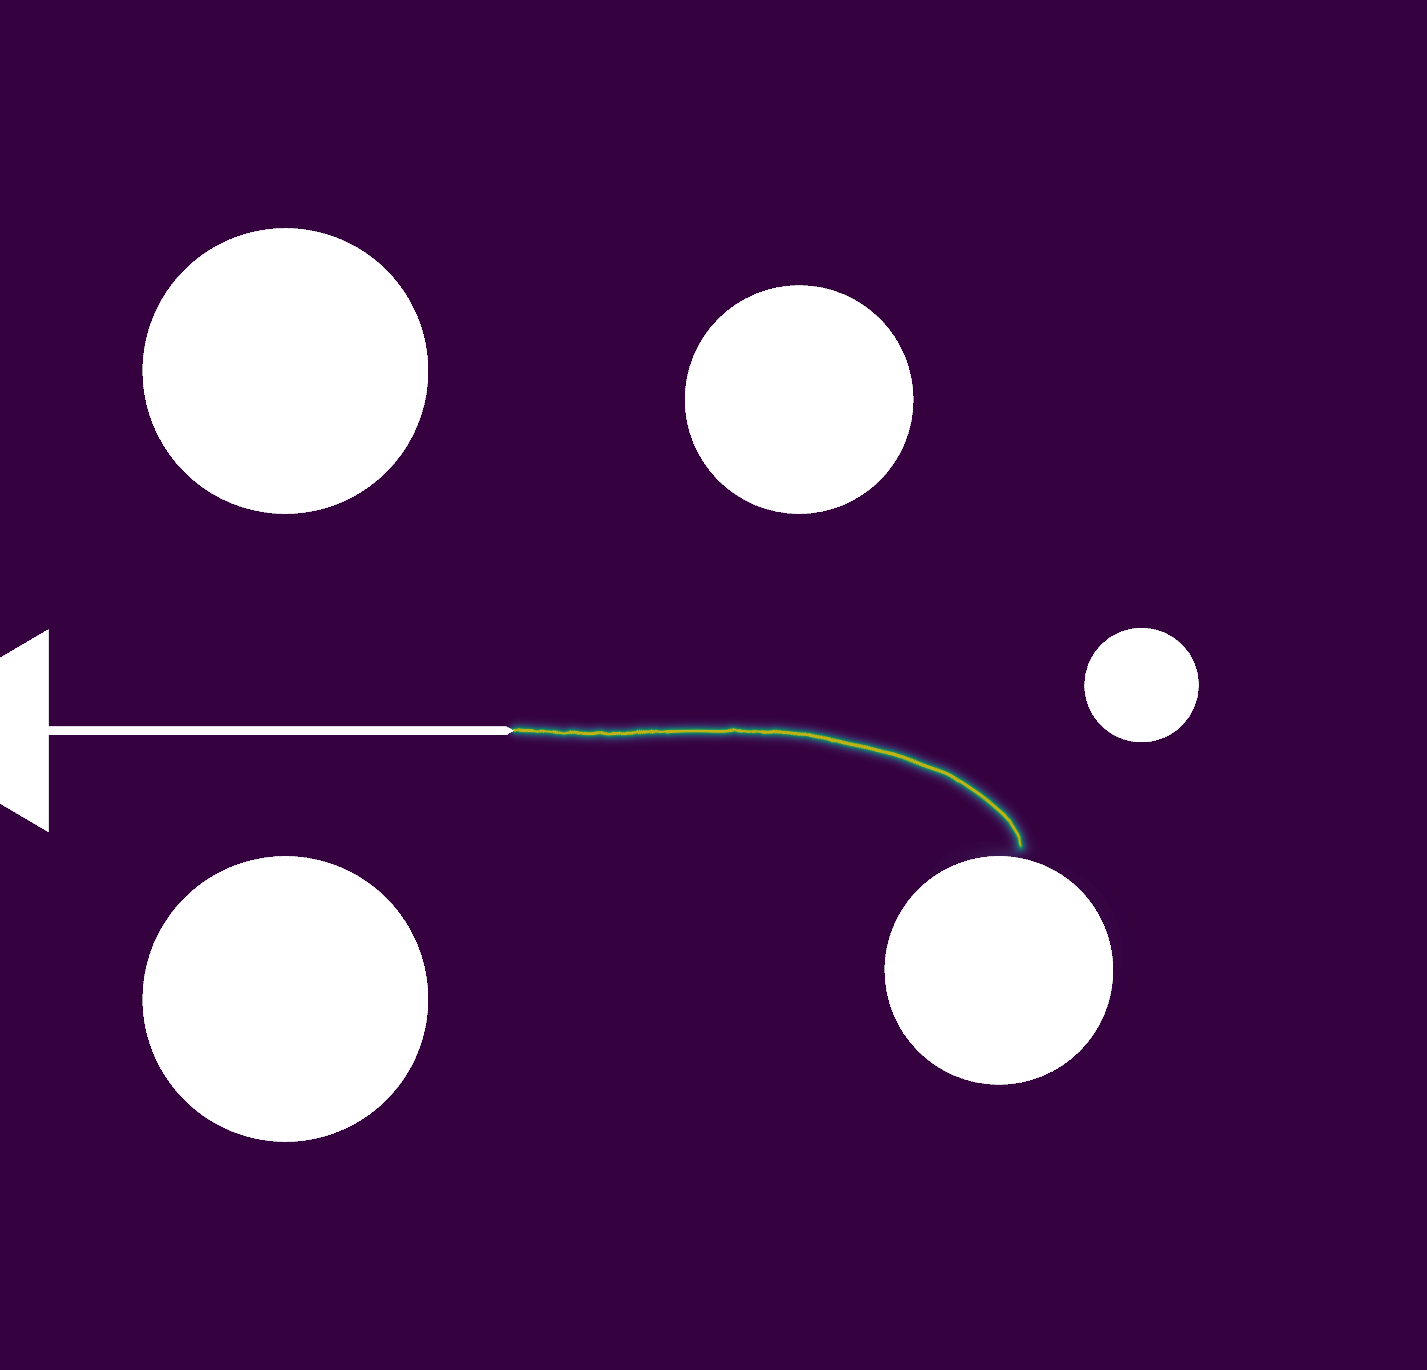
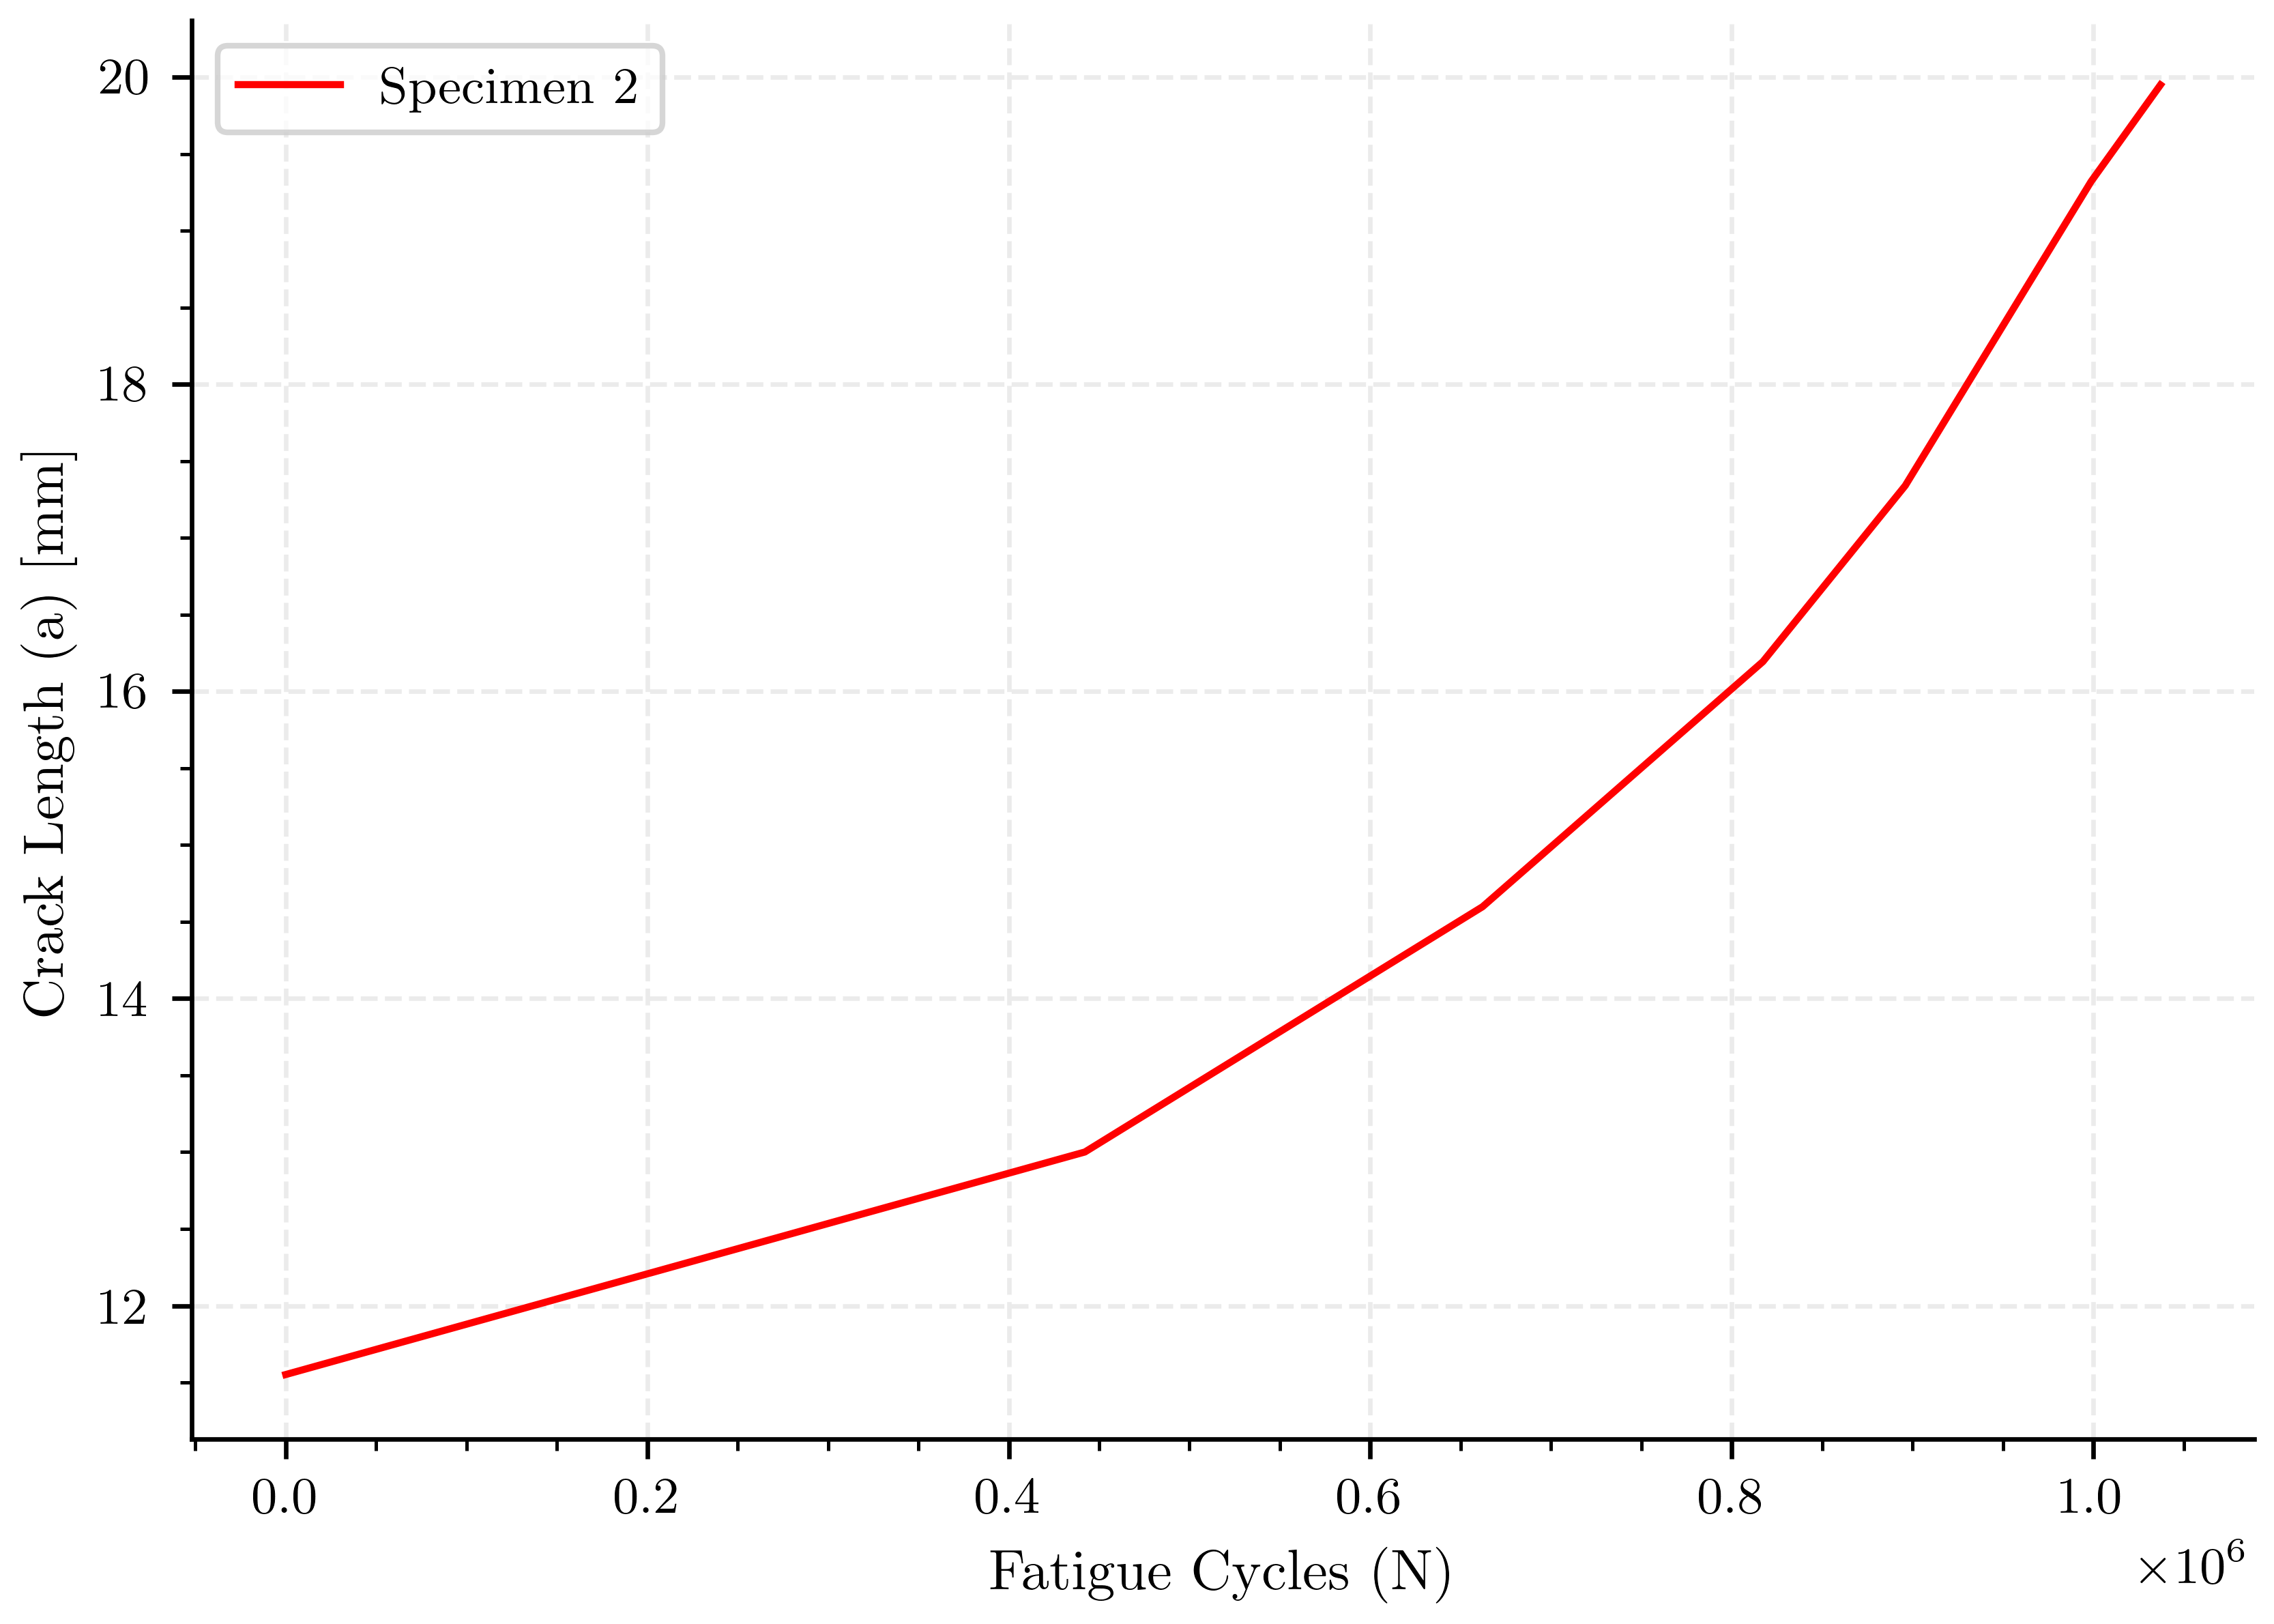
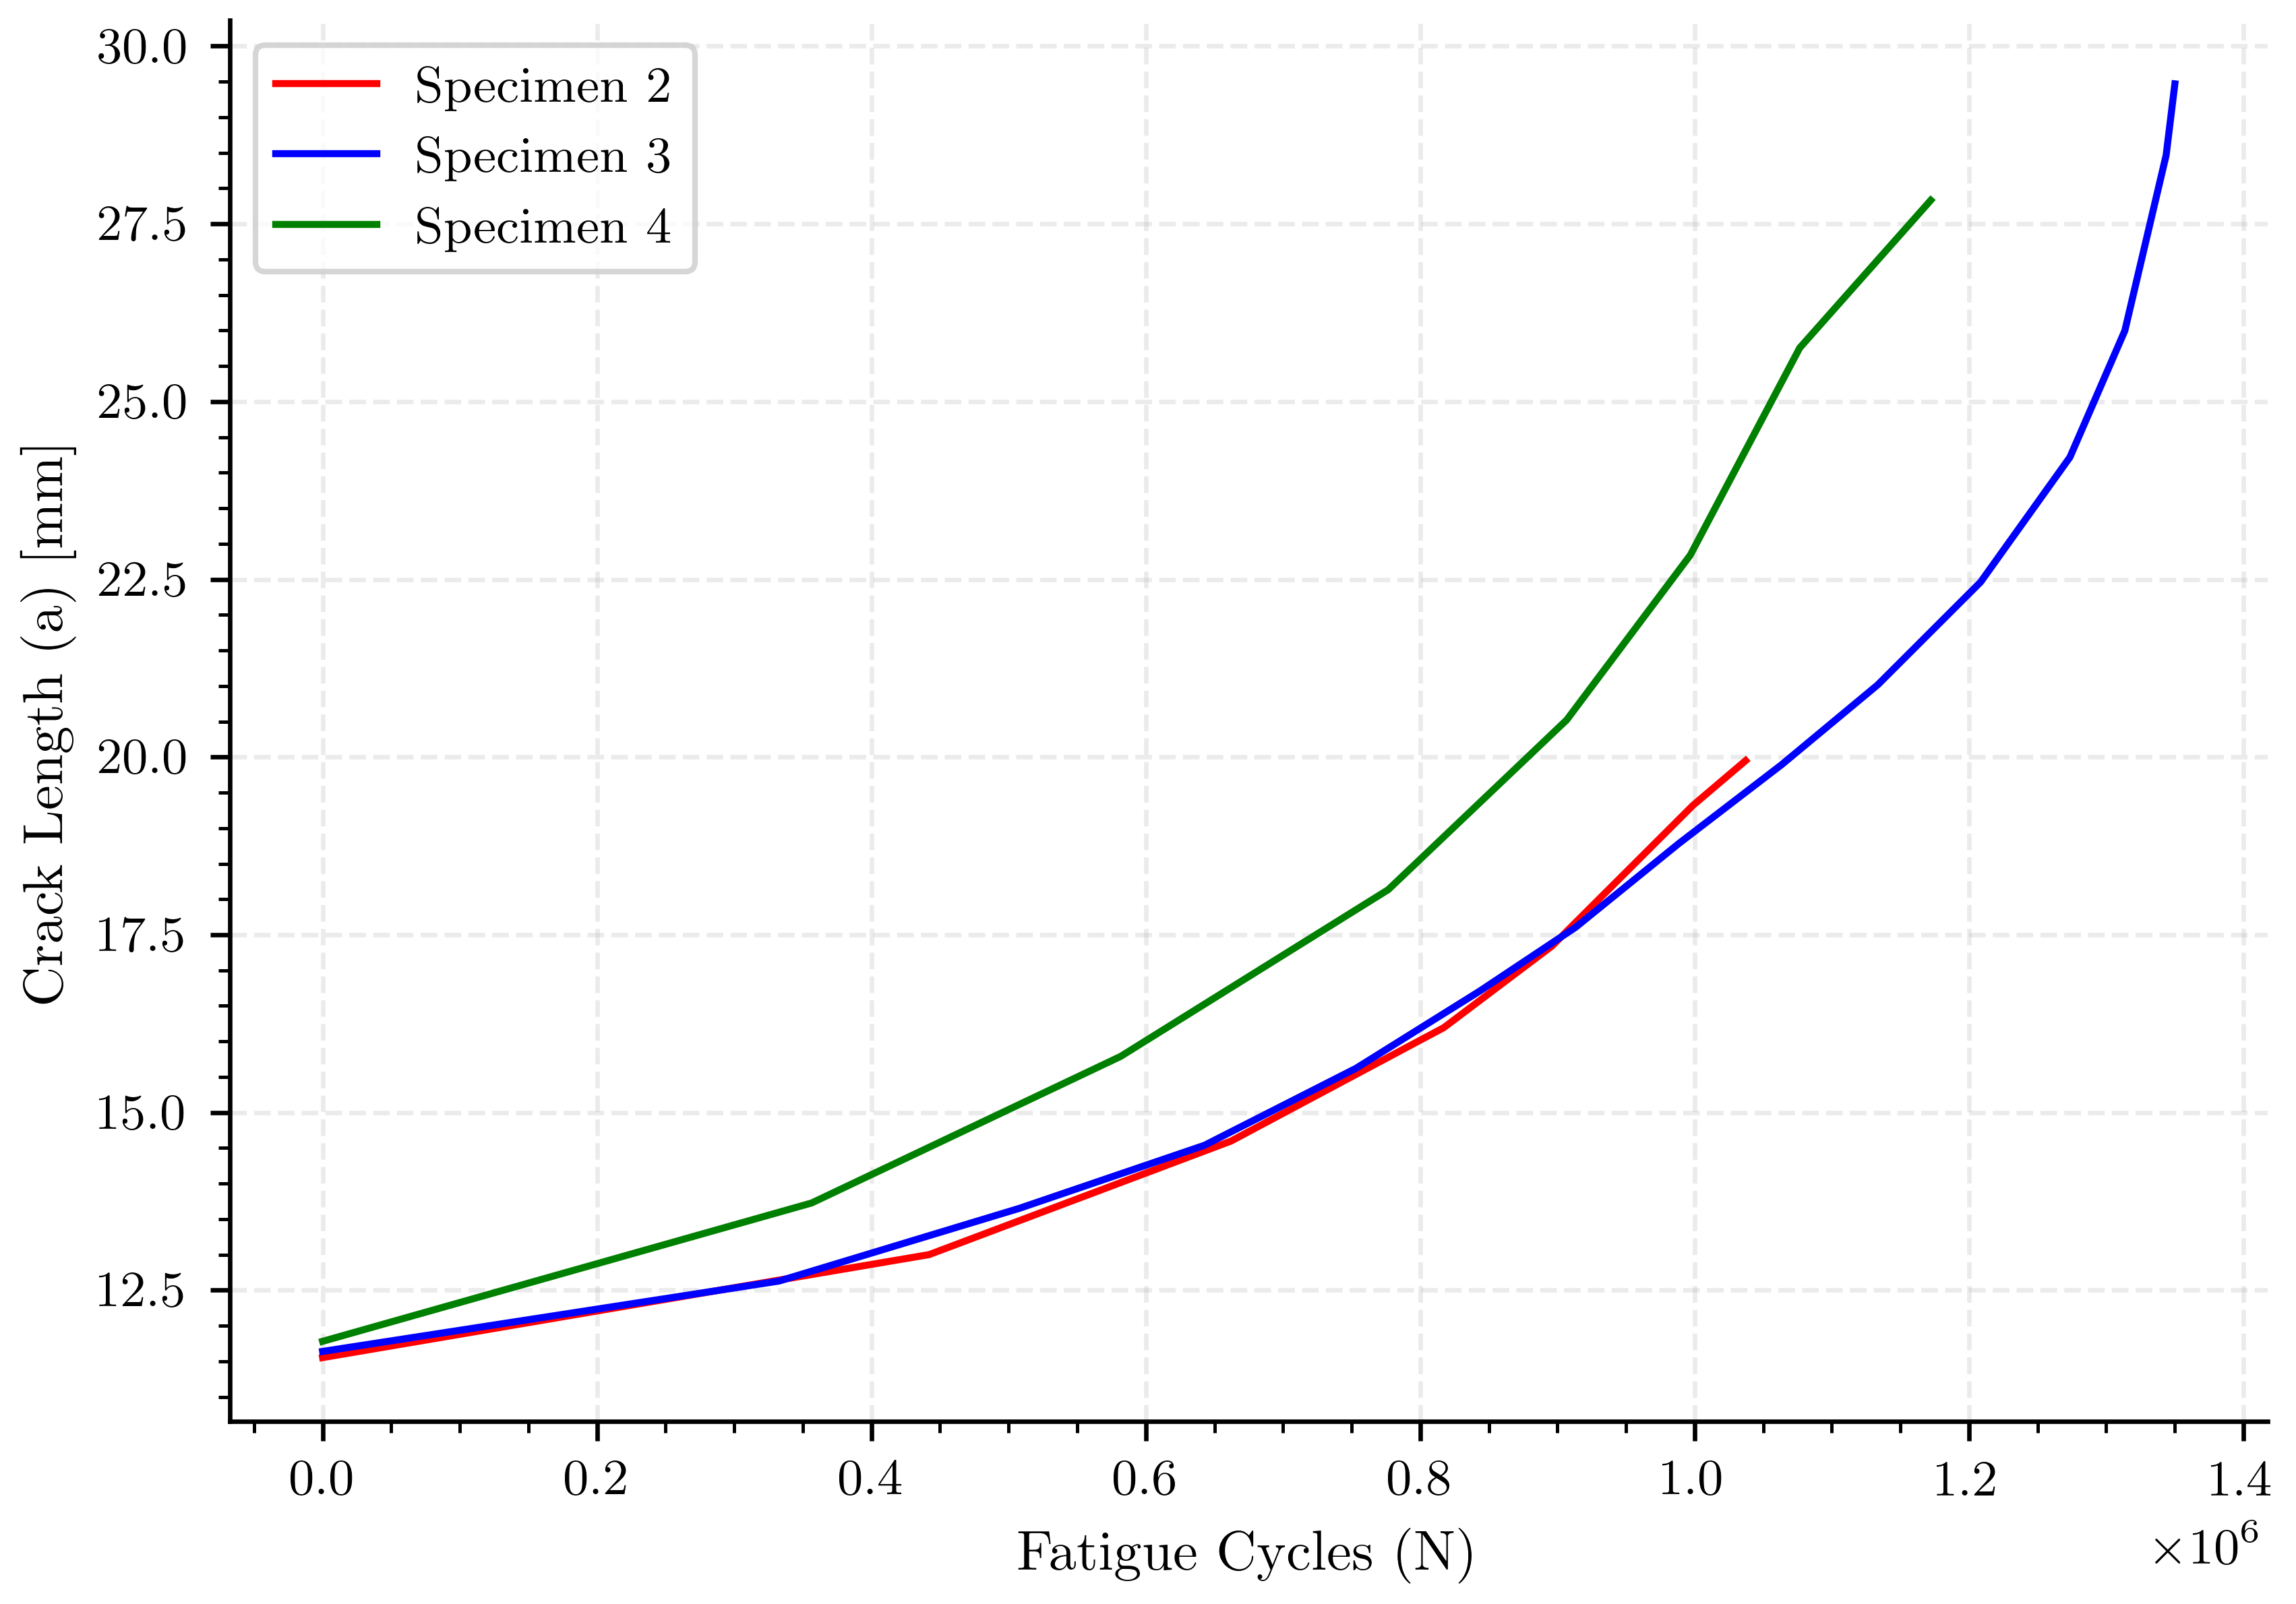
Specimen 2 corresponds to specimen 17-157 in the PhD thesis. This fatigue analysis tracks crack growth until the crack reaches the top hole, denoted as “a”.
speciment_2 = pd.read_csv("../Papers_Data/Wagner_phd/specimen_a/experiment.paper", delim_whitespace=True)
a_2 = speciment_2["total_crack_length"]
N_2 = speciment_2["cycle_count"]


label_paper_2 = 'Specimen 2'
color_paper_2 = 'r'
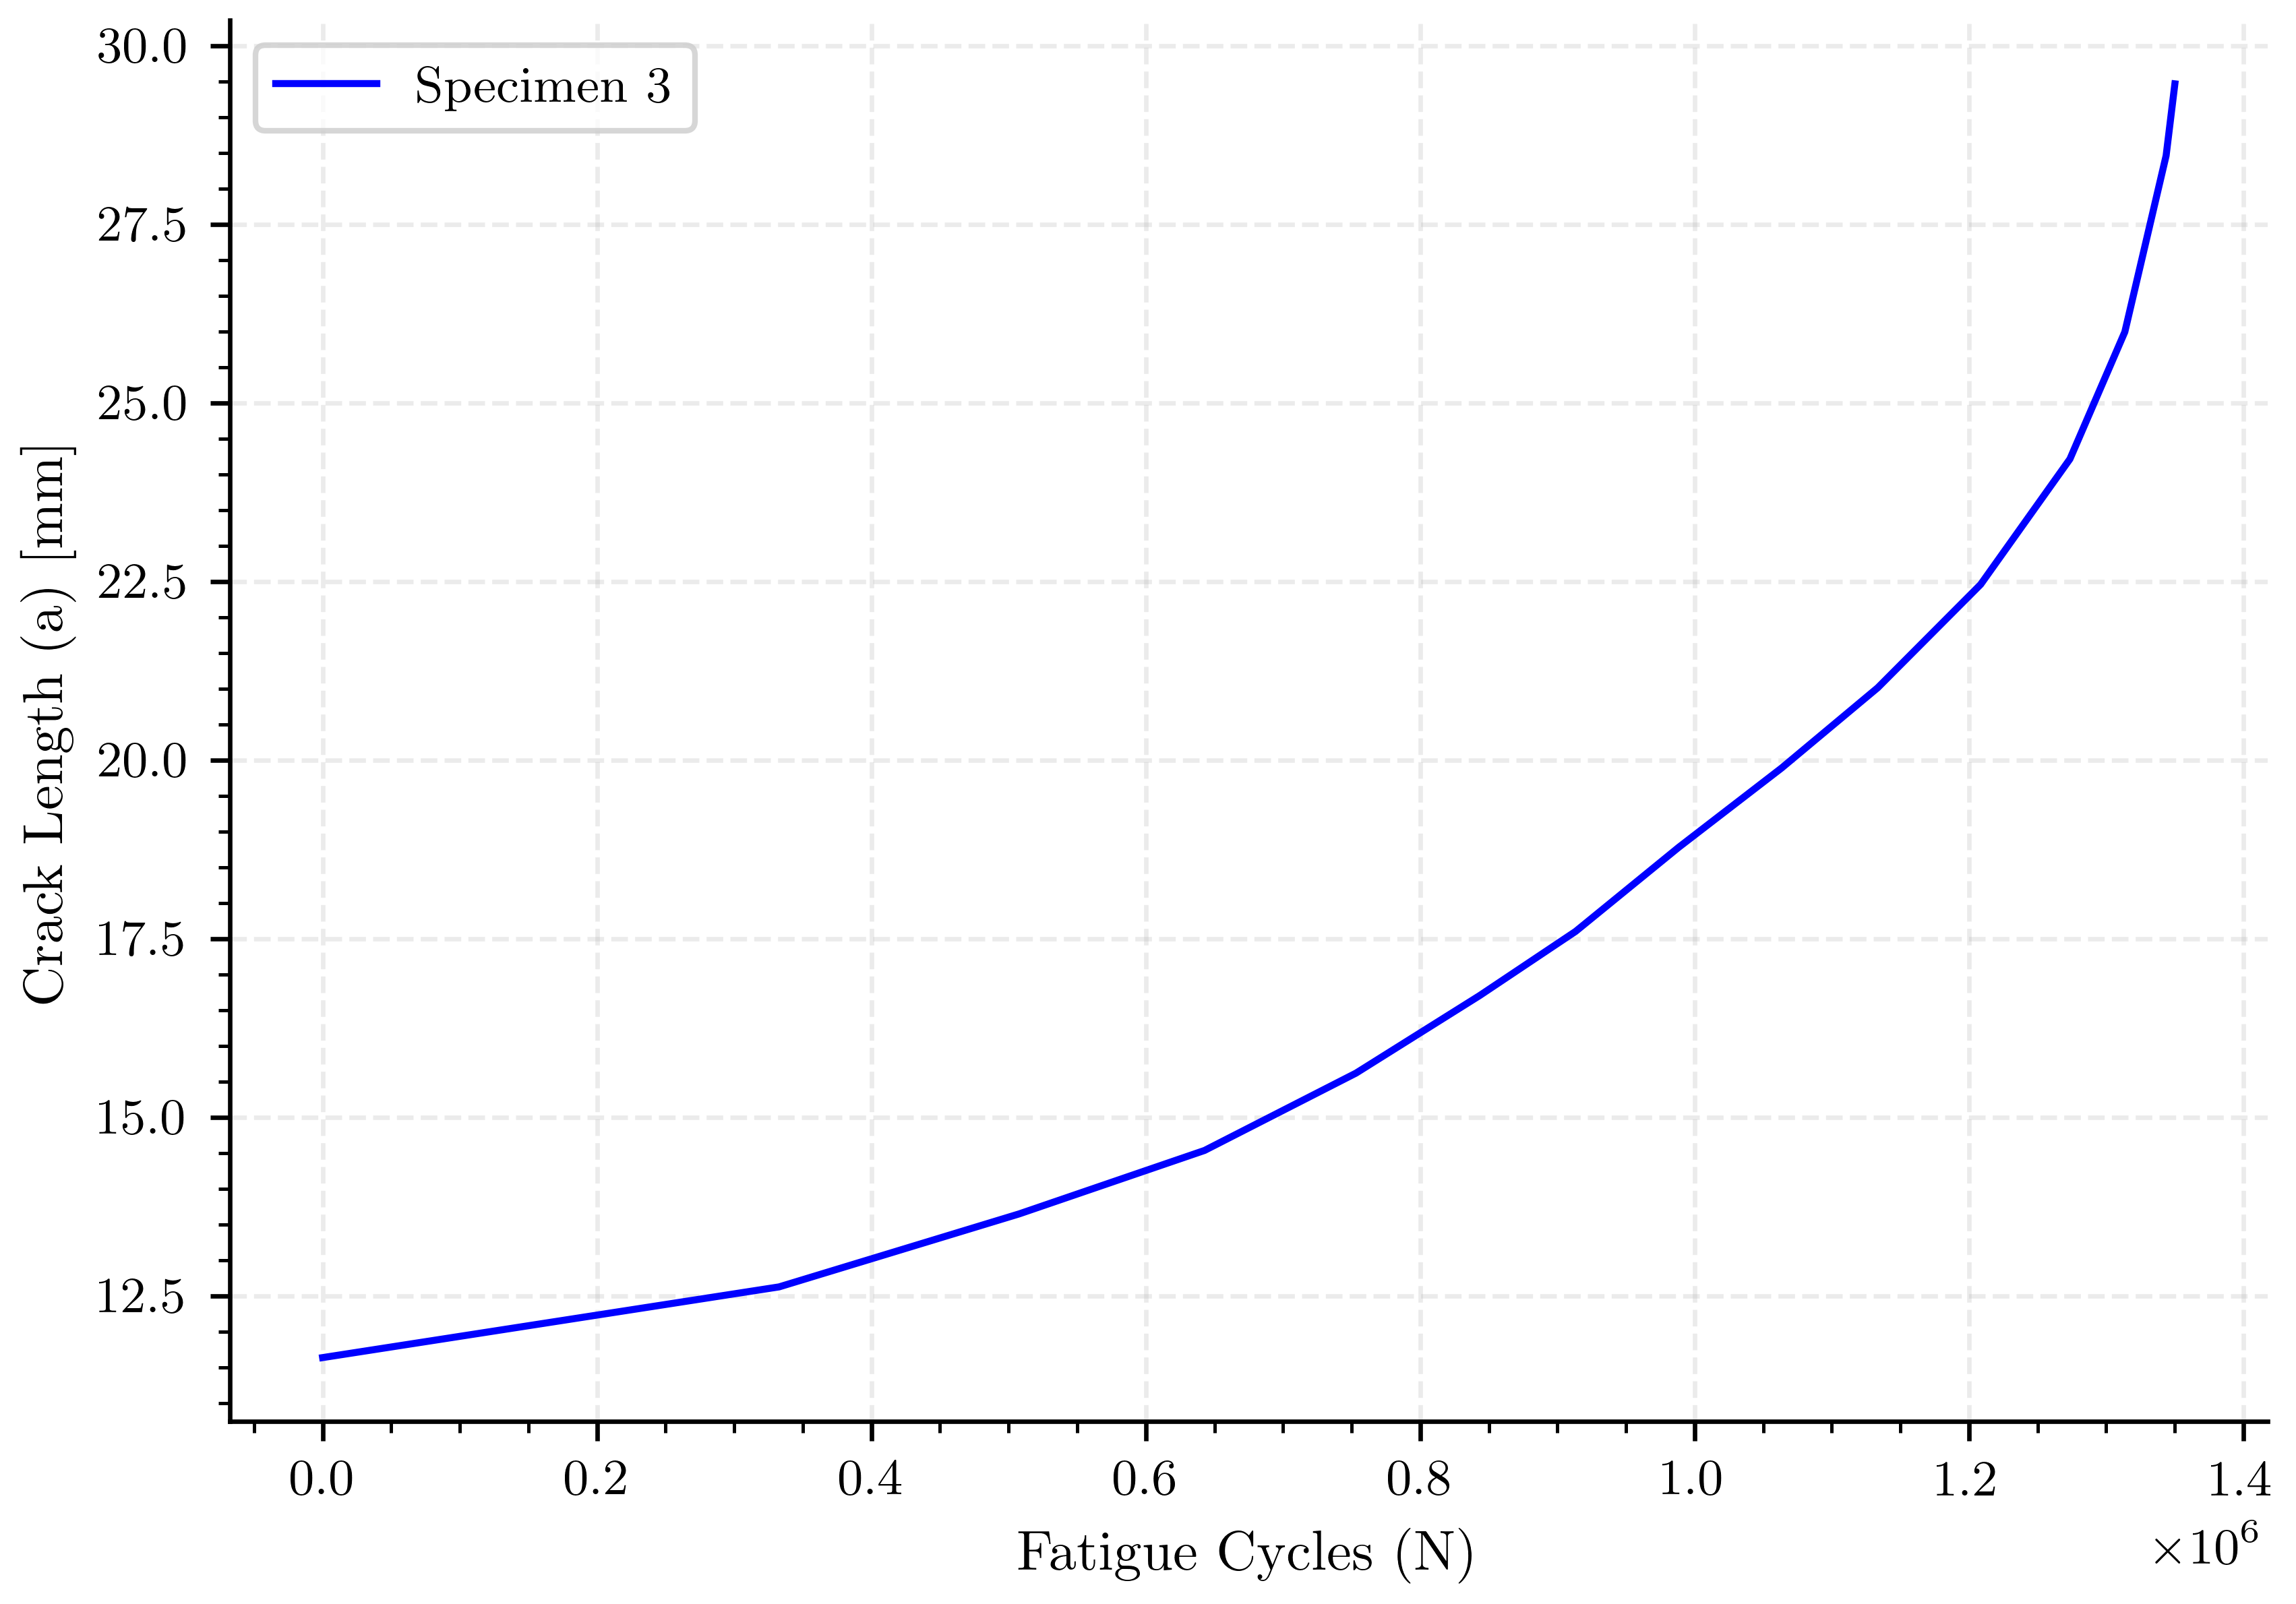
Specimen 3 corresponds to specimen 17-155 in the PhD thesis. This fatigue analysis tracks crack growth until the crack reaches the middle hole, denoted as “b”.
speciment_3 = pd.read_csv("../Papers_Data/Wagner_phd/specimen_b/experiment.paper", delim_whitespace=True)
a_3 = speciment_3["total_crack_length"]
N_3 = speciment_3["cycle_count"]

label_paper_3 = 'Specimen 3'
color_paper_3 = 'b'
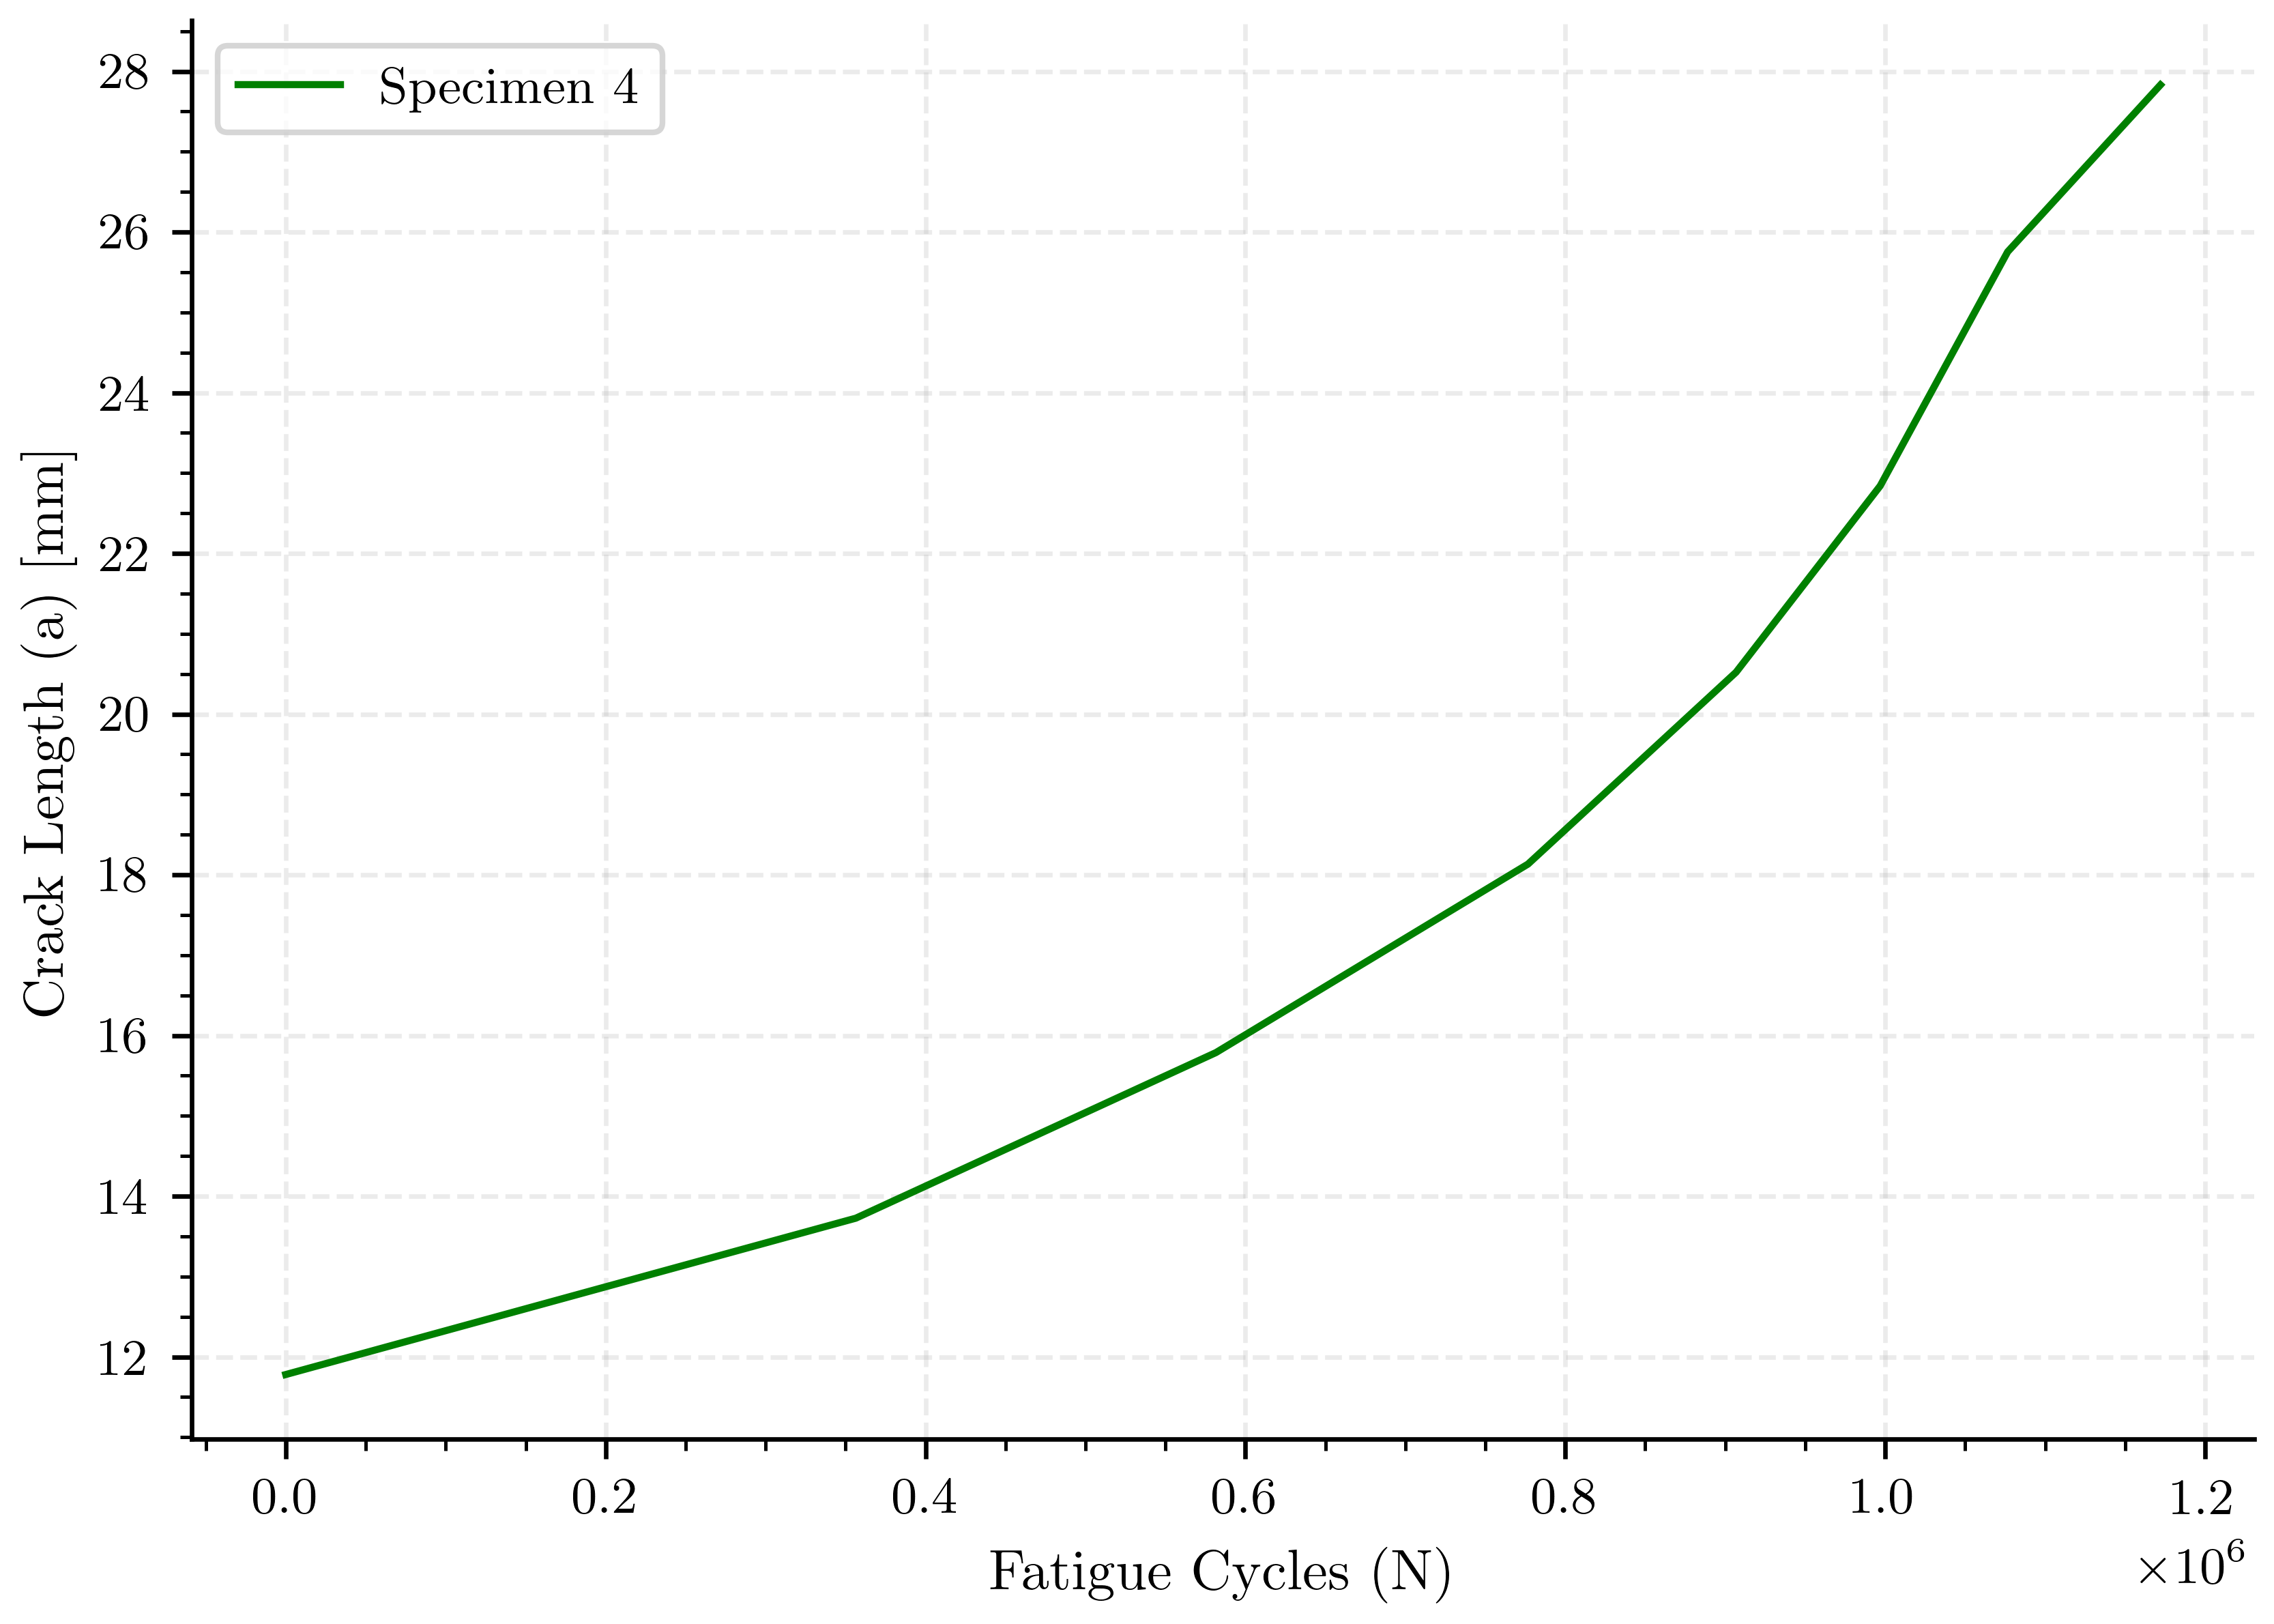
Specimen 4 corresponds to specimen 17-159 in the PhD thesis. This fatigue analysis tracks crack growth until the crack reaches the bottom hole, denoted as “c”.
speciment_4 = pd.read_csv("../Papers_Data/Wagner_phd/specimen_c/experiment.paper", delim_whitespace=True)
a_4 = speciment_4["total_crack_length"]
N_4 = speciment_4["cycle_count"]

label_paper_4 = 'Specimen 4'
color_paper_4 = 'g'
Specimen 2#
fig, ax1 = plt.subplots()

ax1.plot(N_2, a_2, color=color_paper_2, label=label_paper_2)

ax1.set_xlabel(pcfg.cycles_label)
ax1.set_ylabel(pcfg.crack_length_label)
ax1.legend()
<matplotlib.legend.Legend object at 0x734c4d391ea0>
Specimen 3#
fig, ax1 = plt.subplots()

ax1.plot(N_3, a_3, color=color_paper_3, label=label_paper_3)

ax1.set_xlabel(pcfg.cycles_label)
ax1.set_ylabel(pcfg.crack_length_label)
ax1.legend()
<matplotlib.legend.Legend object at 0x734c4d399060>
Specimen 4#
fig, ax1 = plt.subplots()

ax1.plot(N_4, a_4, color=color_paper_4, label=label_paper_4)

ax1.set_xlabel(pcfg.cycles_label)
ax1.set_ylabel(pcfg.crack_length_label)
ax1.legend()
<matplotlib.legend.Legend object at 0x734c4dba22c0>
Compare#
fig, ax1 = plt.subplots()

ax1.plot(N_2, a_2, color=color_paper_2, label=label_paper_2)
ax1.plot(N_3, a_3, color=color_paper_3, label=label_paper_3)
ax1.plot(N_4, a_4, color=color_paper_4, label=label_paper_4)

ax1.set_xlabel(pcfg.cycles_label)
ax1.set_ylabel(pcfg.crack_length_label)
ax1.legend()

plt.show()
Total running time of the script: (0 minutes 2.104 seconds)